Fig. 3
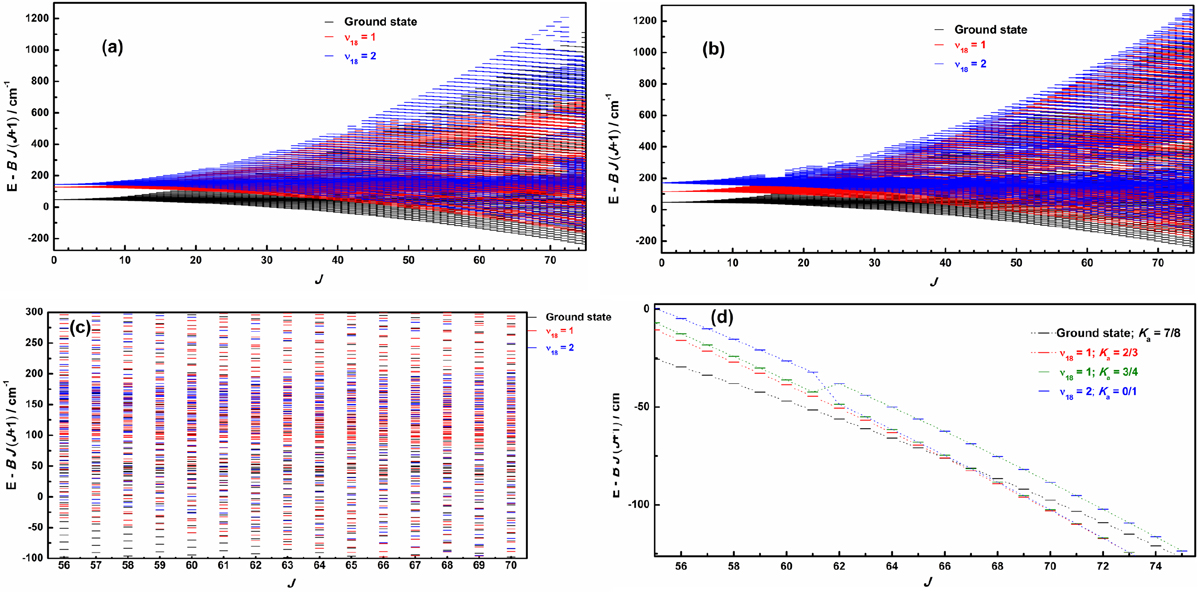
(a,b) Torsion-rotation diagrams (reduced energy) [E − BJ(J + 1)] in the ground state, the ν18 = 1 and ν18 = 2 states of torsion for both A-species (left plot) and E-species (right plot). (c) An enlargement of the torsion-rotation diagram for J values between 56 and 70 in order to highlight how energy levels become close to each other. (d) Examples of perturbations between different torsional states (avoided crossings are shown around J = 61 and 62, as well as around J = 66).
Current usage metrics show cumulative count of Article Views (full-text article views including HTML views, PDF and ePub downloads, according to the available data) and Abstracts Views on Vision4Press platform.
Data correspond to usage on the plateform after 2015. The current usage metrics is available 48-96 hours after online publication and is updated daily on week days.
Initial download of the metrics may take a while.