Fig. 4
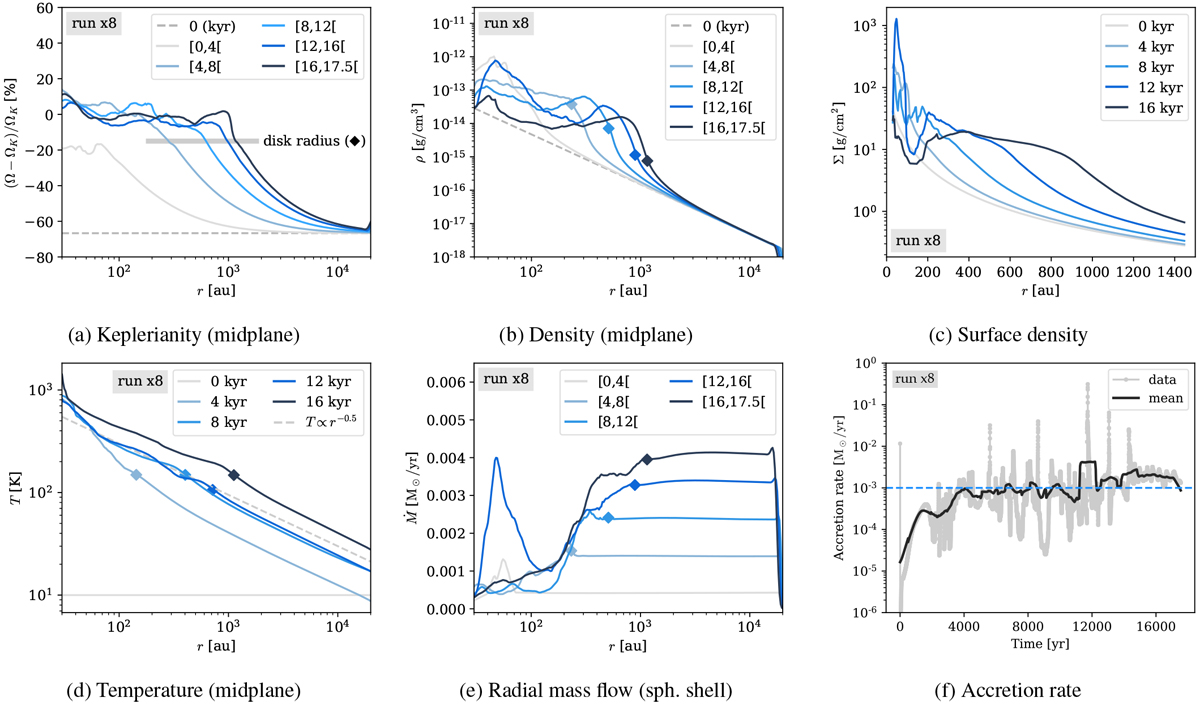
(a)–(e) Radial profiles of several quantities for the background disk. The intervals in profiles (a), (d), and (e) mean that the quantity has been time-averaged in that interval, excluding the endpoint. The filled diamond indicates the value at the disk radius. (f) Accretion rate into the central massive protostar as a function of time.
Current usage metrics show cumulative count of Article Views (full-text article views including HTML views, PDF and ePub downloads, according to the available data) and Abstracts Views on Vision4Press platform.
Data correspond to usage on the plateform after 2015. The current usage metrics is available 48-96 hours after online publication and is updated daily on week days.
Initial download of the metrics may take a while.