Fig. 23
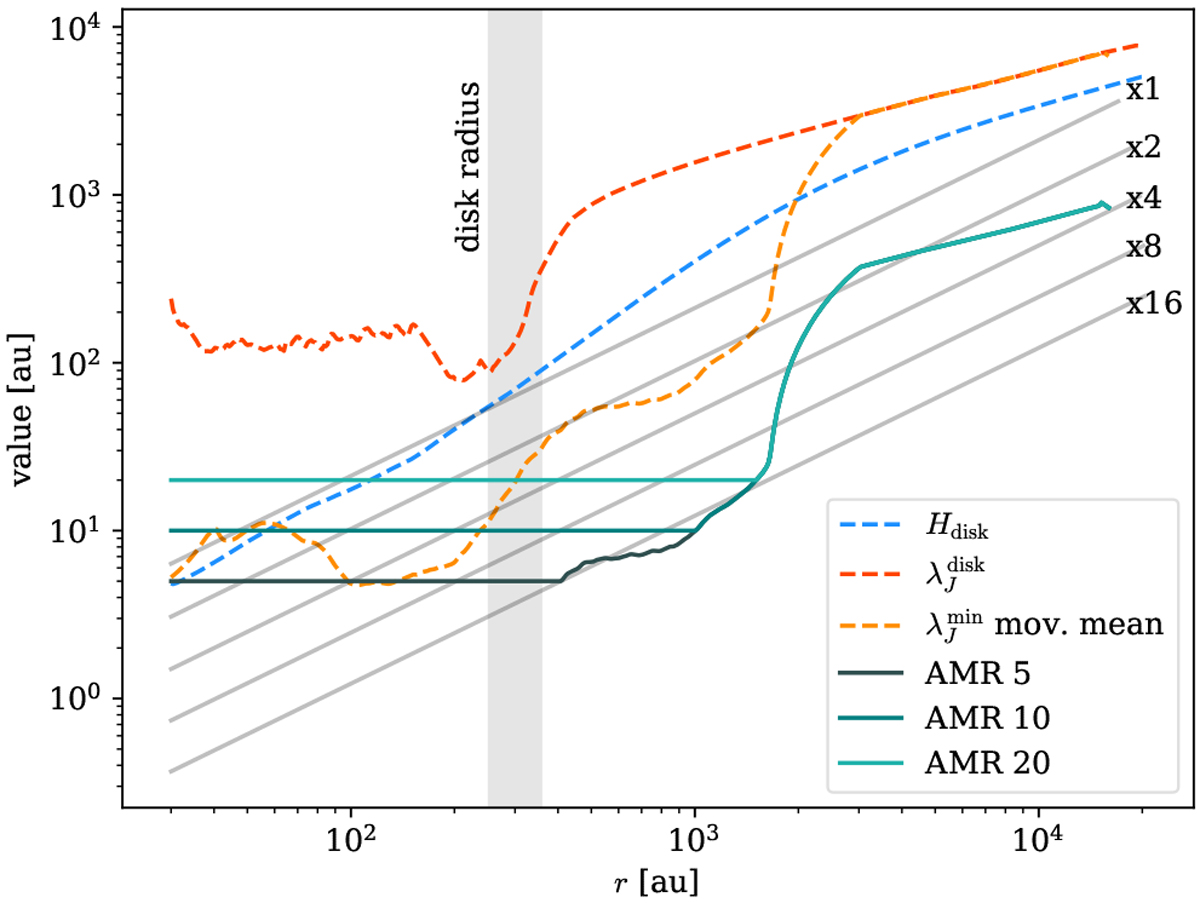
Comparison of midplane grid cell sizes in our fixed grid and other studies that use AMR. The different relevant scales of thesystem are shown as dashed lines; these were calculated as averages for the time period [6,8] kyr, and the corresponding disk radius is shown in the gray box. The number following the label for the AMR curves indicates the minimum cell size in astronomical units.
Current usage metrics show cumulative count of Article Views (full-text article views including HTML views, PDF and ePub downloads, according to the available data) and Abstracts Views on Vision4Press platform.
Data correspond to usage on the plateform after 2015. The current usage metrics is available 48-96 hours after online publication and is updated daily on week days.
Initial download of the metrics may take a while.