Fig. 21
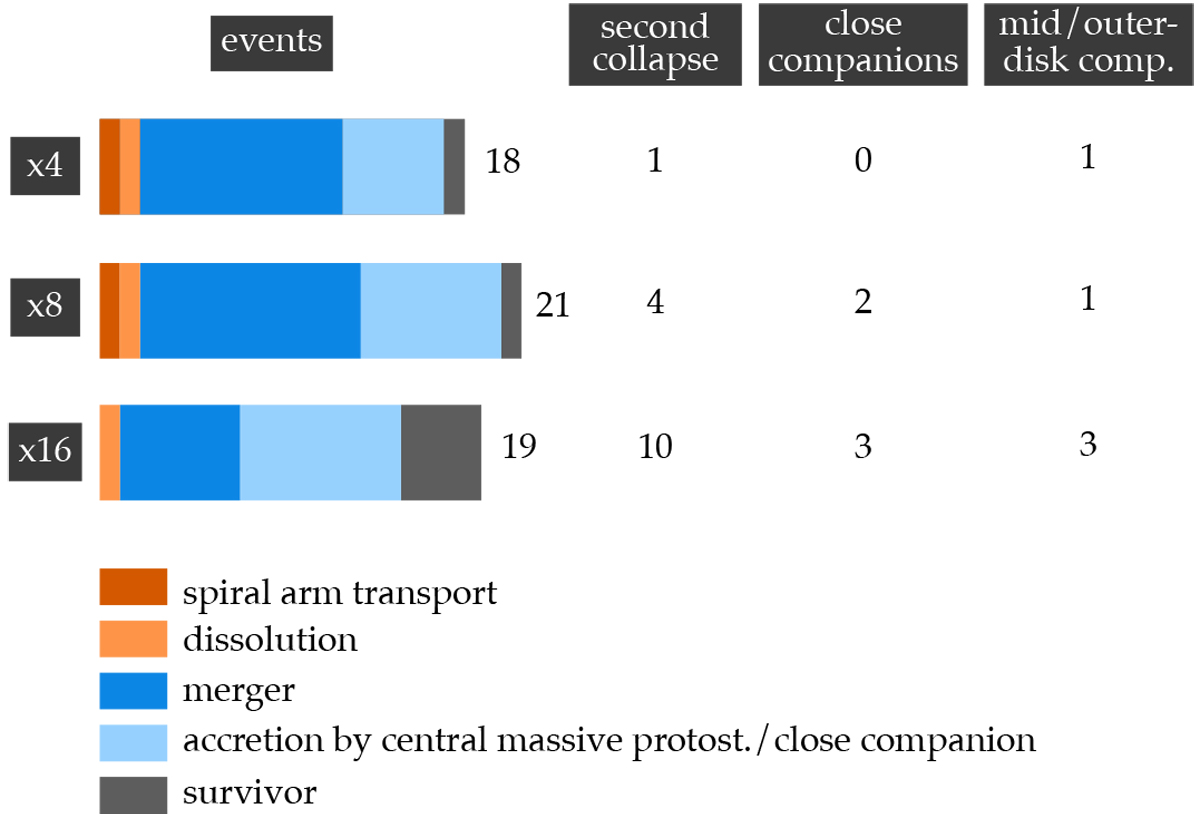
Fragment statistics for the fragment-producing runs. The charts show the fate of the fragments with a life longer than 200 yr according to the simulation, that is without taking into account the effects of the inner boundary and hydrogen dissociation, as discussed in Sect. 7.2. The estimated number of these fragments that undergo second collapse is given in the right-hand column.
Current usage metrics show cumulative count of Article Views (full-text article views including HTML views, PDF and ePub downloads, according to the available data) and Abstracts Views on Vision4Press platform.
Data correspond to usage on the plateform after 2015. The current usage metrics is available 48-96 hours after online publication and is updated daily on week days.
Initial download of the metrics may take a while.