Fig. 7
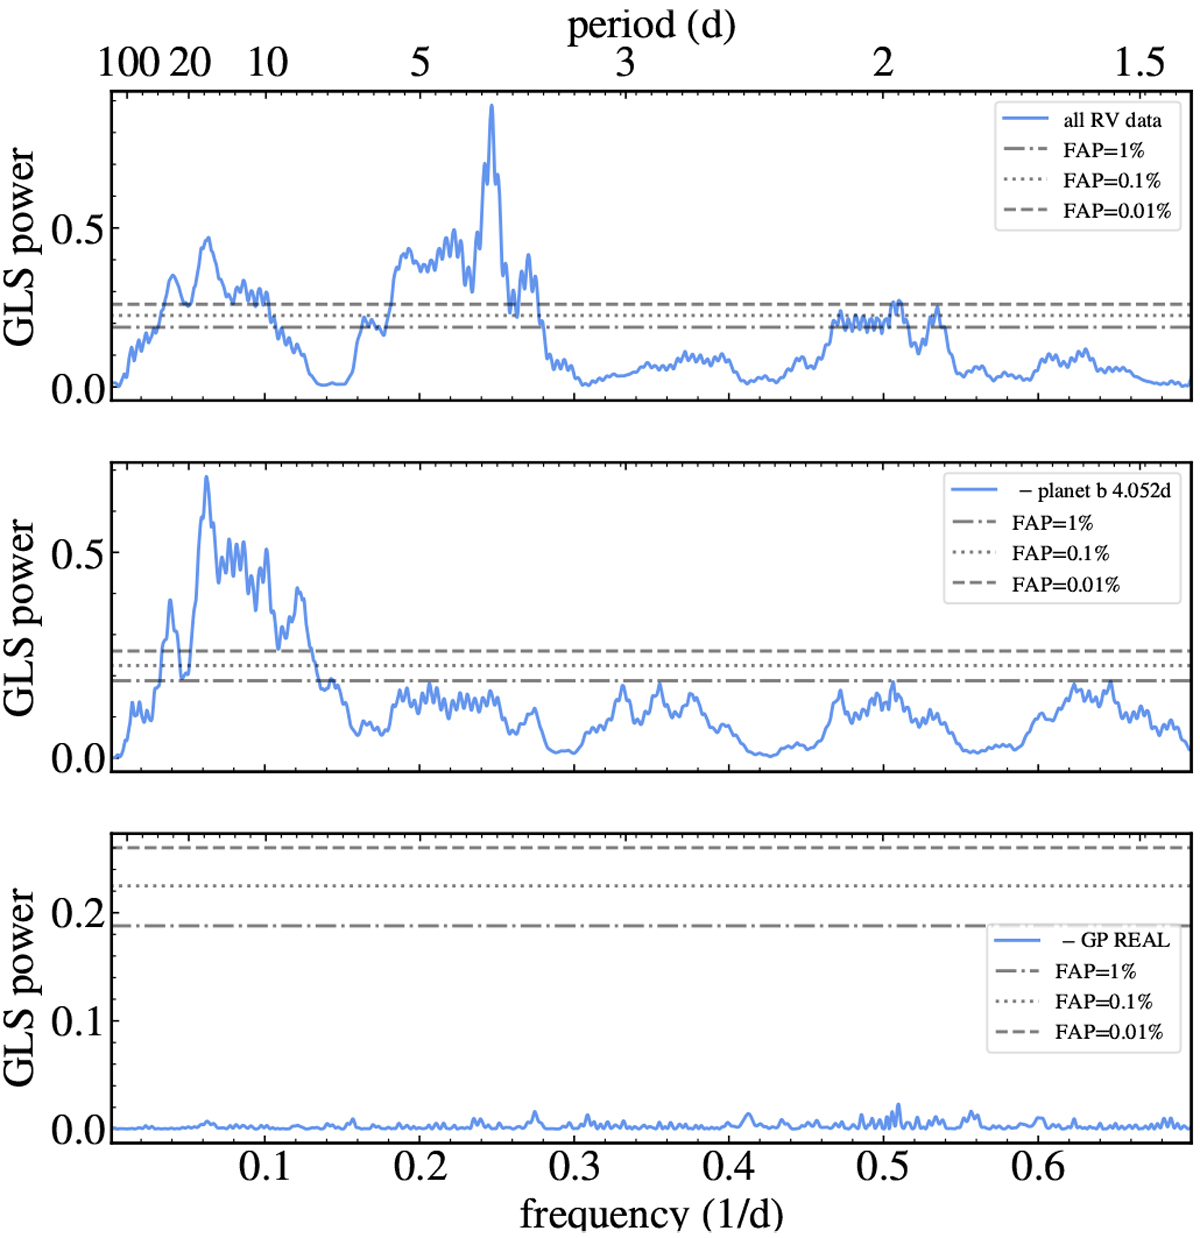
GLS periodograms of the combined radial-velocity data corrected for individual offsets: Subsequent pre-whitening of the radial-velocity data (top) with the signal of LP 714-47 b (middle) and the GP modelling the correlated noise (bottom). Horizontal lines indicate the false alarm probability of 1%, 0.11%, and 0.01%, respectively.
Current usage metrics show cumulative count of Article Views (full-text article views including HTML views, PDF and ePub downloads, according to the available data) and Abstracts Views on Vision4Press platform.
Data correspond to usage on the plateform after 2015. The current usage metrics is available 48-96 hours after online publication and is updated daily on week days.
Initial download of the metrics may take a while.