Fig. 5
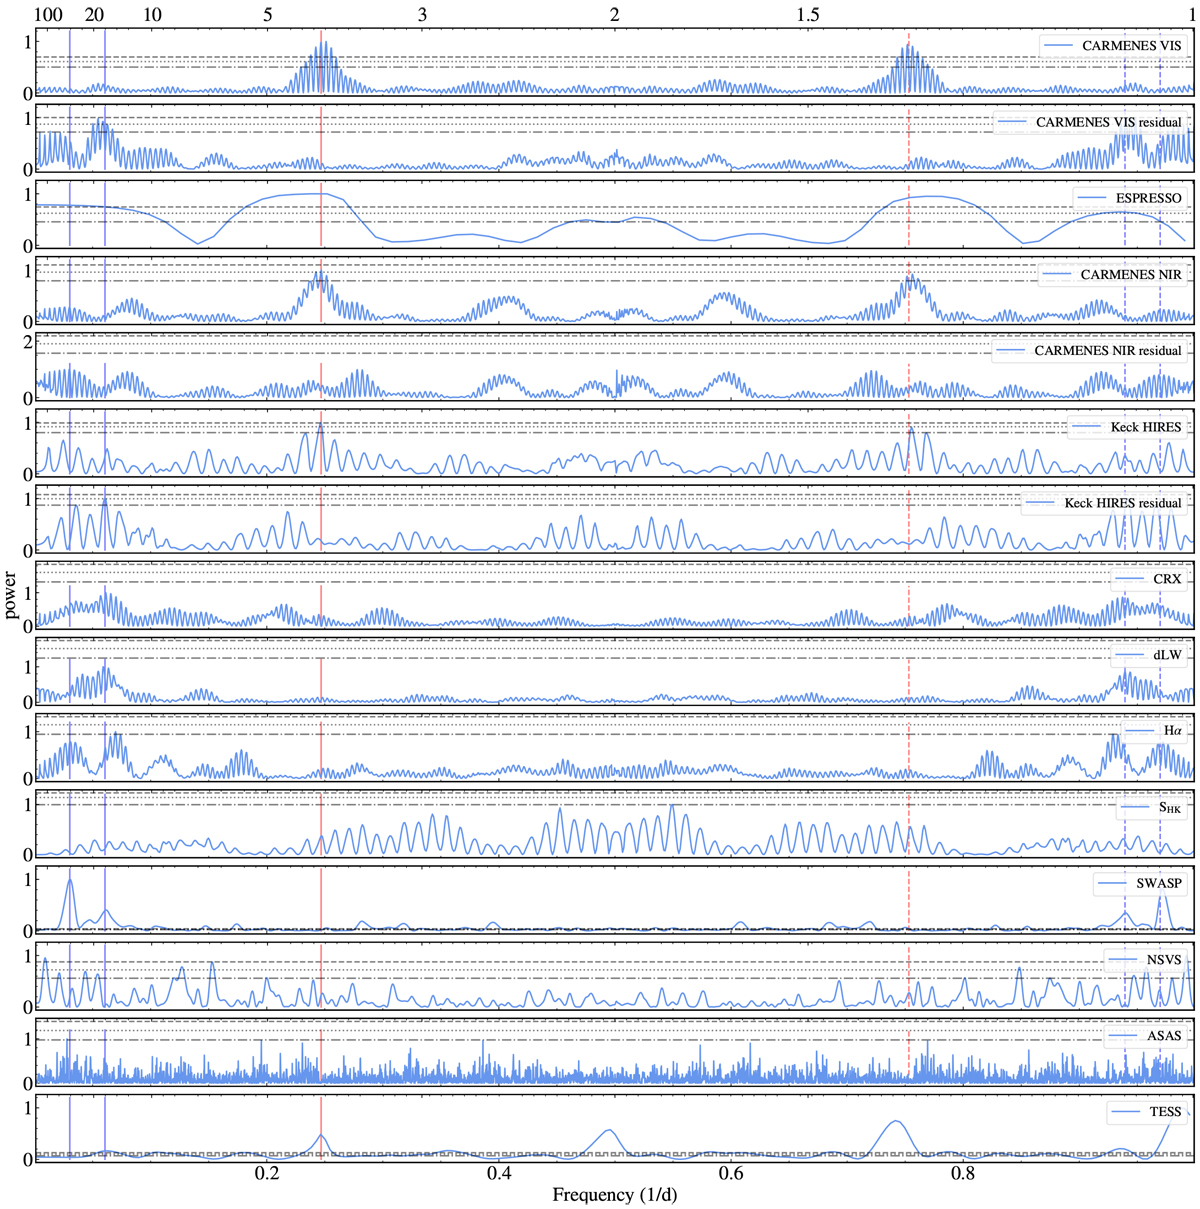
Periodogram of radial-velocity data with sufficiently long coverage, spectral activity indicators, long-term photometry,and TESS light curve. The red vertical line indicates the planet period, the blue vertical lines indicate the potential rotation period at 33 d and its first harmonic, while the corresponding dashed lines mark the 1-day alias in the ground-based data sets. For CARMENES VIS and NIR, as well as for Keck/HIRES, we also show the periodogram of the residuals after subtracting the planet signal. Horizontal lines indicate the false alarm probability of 10%, 1%, and 0.1%, respectively.
Current usage metrics show cumulative count of Article Views (full-text article views including HTML views, PDF and ePub downloads, according to the available data) and Abstracts Views on Vision4Press platform.
Data correspond to usage on the plateform after 2015. The current usage metrics is available 48-96 hours after online publication and is updated daily on week days.
Initial download of the metrics may take a while.