Fig. 4
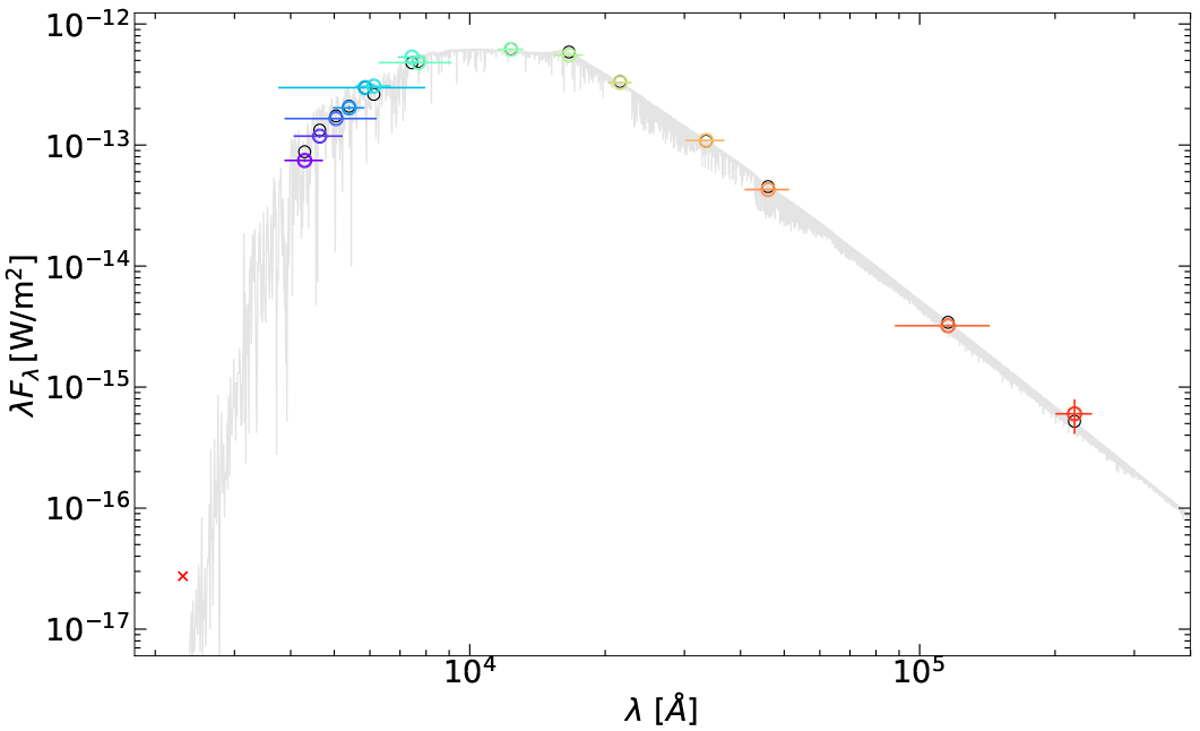
Spectral energy distribution (SED). Coloured circles represent the photometry, where the horizontal bars represent the effectivewidth of the passbands. Black circles are predicted magnitudes within the observed bandpasses integrated from the best-fit BT-Settl CIFIST atmosphere model (Baraffe et al. 2015; light grey curve) available to VOSA (Bayo et al. 2008).
Current usage metrics show cumulative count of Article Views (full-text article views including HTML views, PDF and ePub downloads, according to the available data) and Abstracts Views on Vision4Press platform.
Data correspond to usage on the plateform after 2015. The current usage metrics is available 48-96 hours after online publication and is updated daily on week days.
Initial download of the metrics may take a while.