Free Access
Fig. F.4
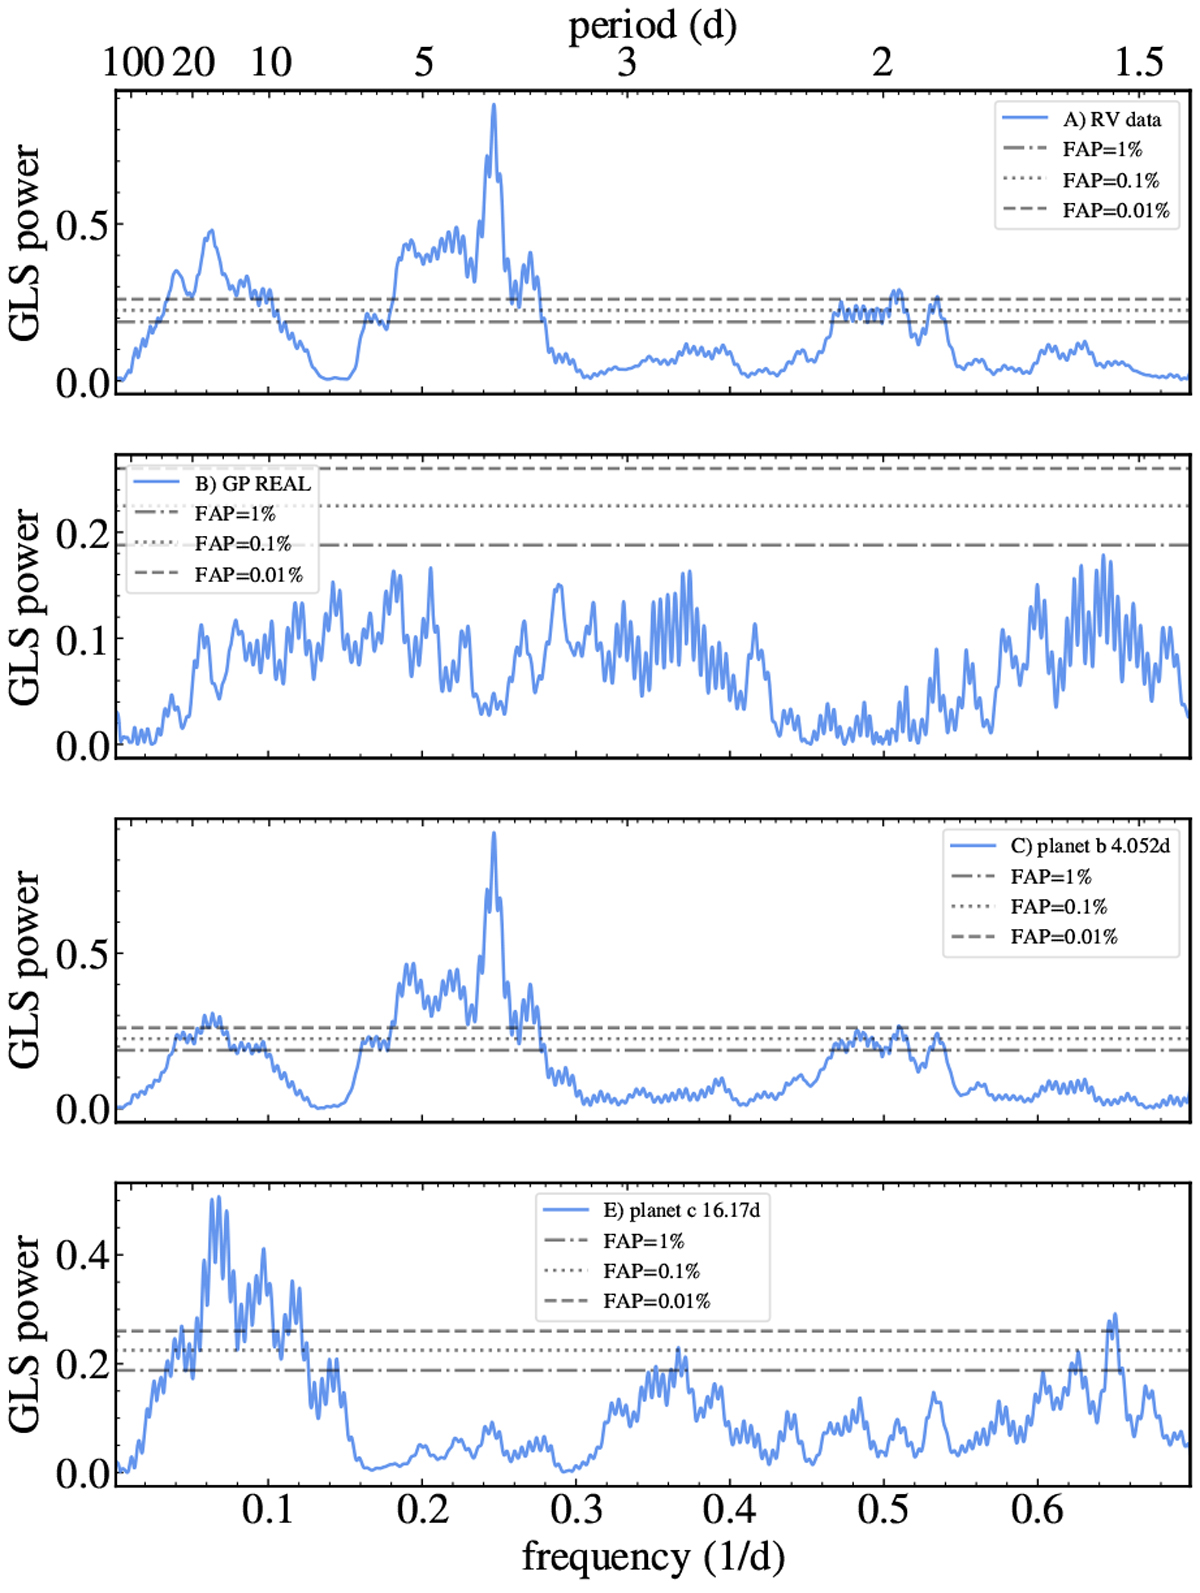
Periodogams of the model components: original radial-velocity data (top) the Gaussian process modelling the correlated noise (second panel), planet b (third panel), and the potential second planet (bottom). Horizontal lines indicate the false alarm probability of 1%, 0.11%, and 0.01%, respectively.
Current usage metrics show cumulative count of Article Views (full-text article views including HTML views, PDF and ePub downloads, according to the available data) and Abstracts Views on Vision4Press platform.
Data correspond to usage on the plateform after 2015. The current usage metrics is available 48-96 hours after online publication and is updated daily on week days.
Initial download of the metrics may take a while.