Fig. A.1
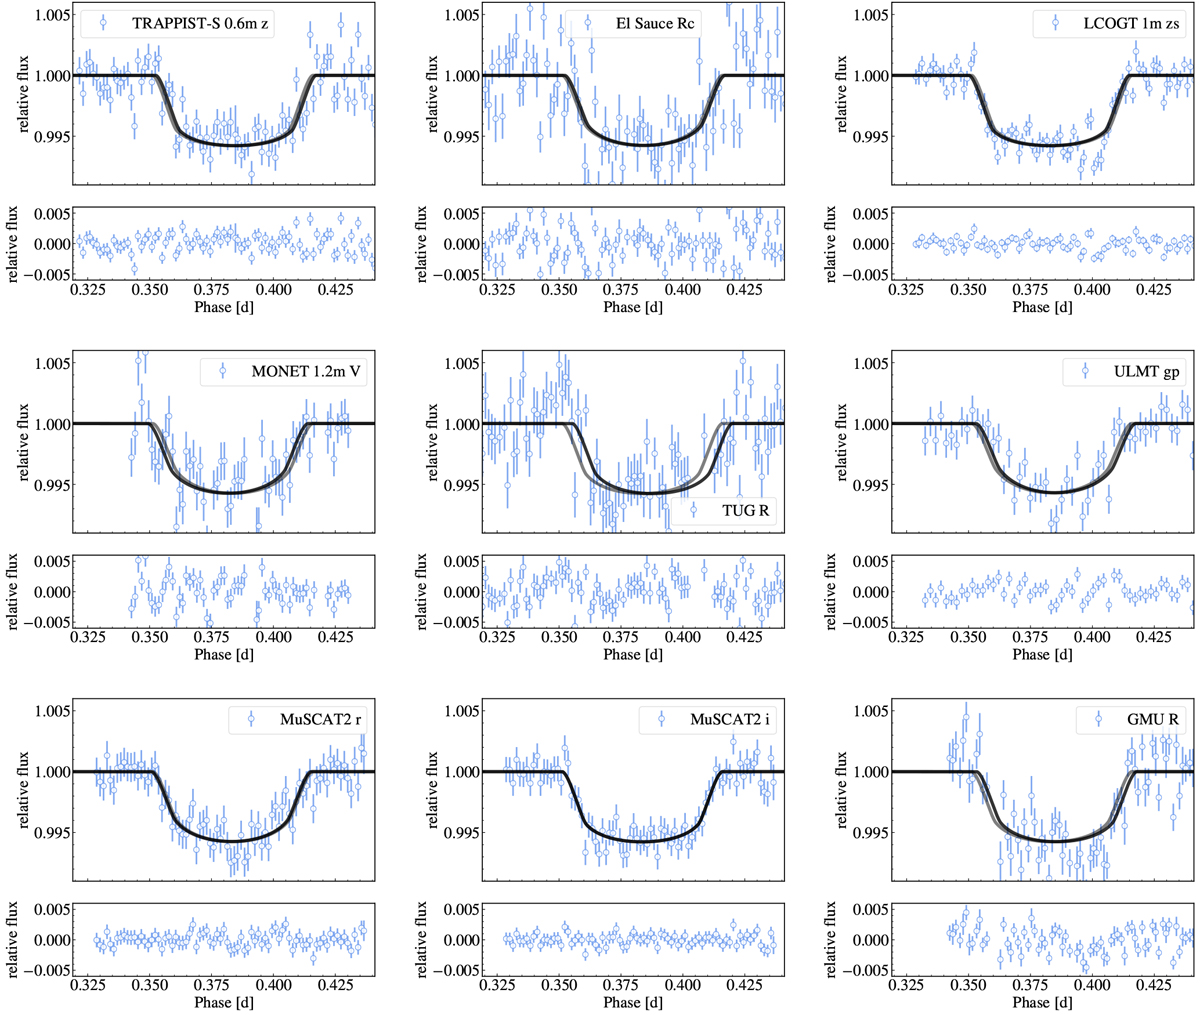
Ground-based transits (1 minute bins) compared to the best fit model (grey) and a model allowing small shifts in transit times (black). TRAPPIST, LCOGT, and El Sauce data were obtained at transit 24, MONET at 79, TUG at 81, ULM at 87, MuSCAT2 at 99 and 100, and GMU at 101, relative to the first TESS transit. MuSCAT2 transits in filter g and z are shown in the main text (Fig. 10).
Current usage metrics show cumulative count of Article Views (full-text article views including HTML views, PDF and ePub downloads, according to the available data) and Abstracts Views on Vision4Press platform.
Data correspond to usage on the plateform after 2015. The current usage metrics is available 48-96 hours after online publication and is updated daily on week days.
Initial download of the metrics may take a while.