Fig. 8
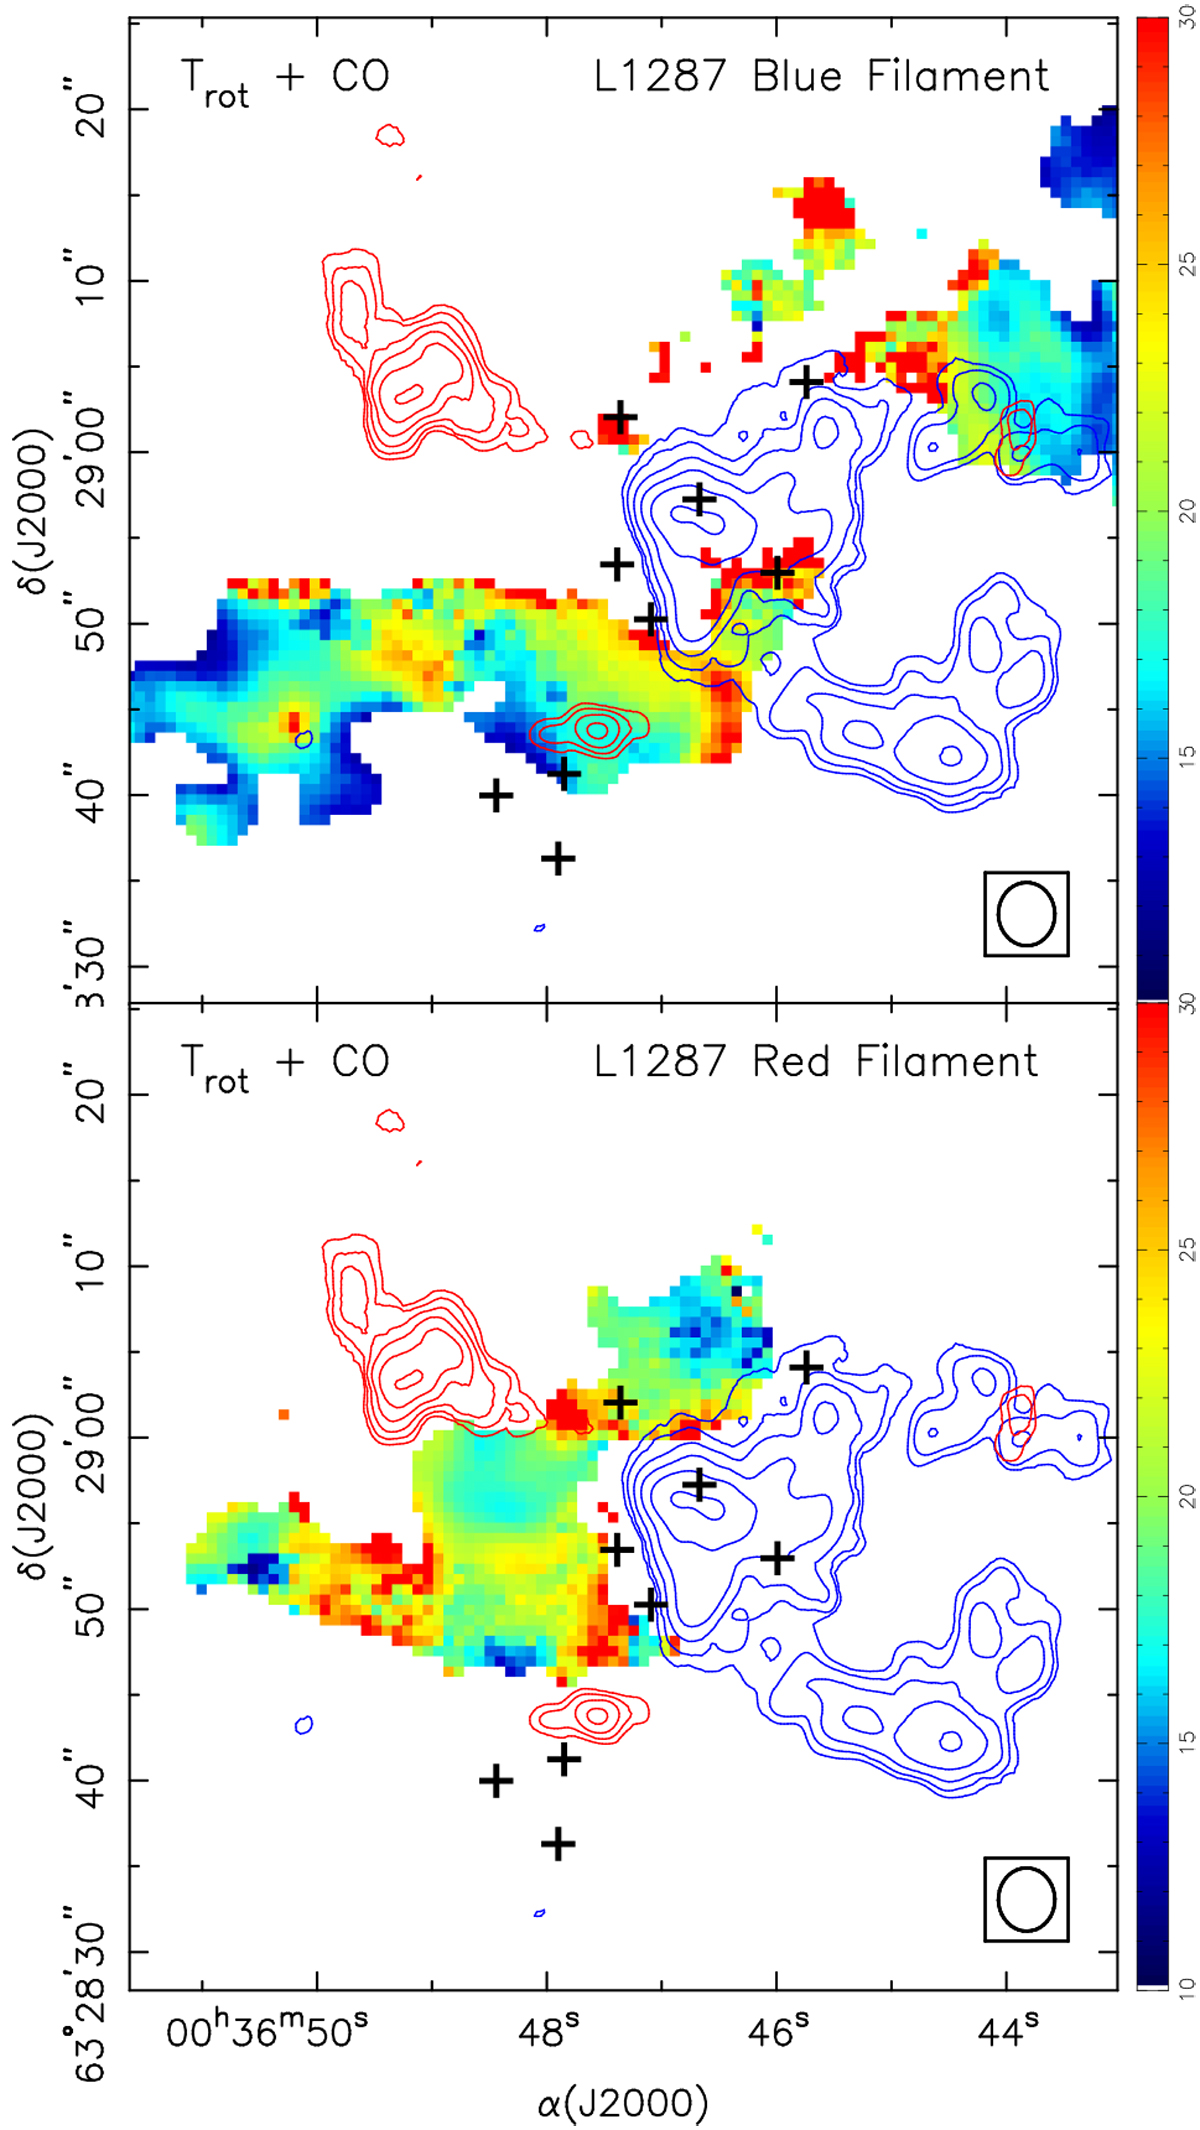
Magnified image of the L1287 rotational temperature of the blue filament (top) and red filament (bottom), superimposed on the high-velocity CO emission (blue and red contours). There is a clear temperature increase at the walls of the cavity where the blue lobe of the outflow propagates. The crosses are the same as in Fig. 3.
Current usage metrics show cumulative count of Article Views (full-text article views including HTML views, PDF and ePub downloads, according to the available data) and Abstracts Views on Vision4Press platform.
Data correspond to usage on the plateform after 2015. The current usage metrics is available 48-96 hours after online publication and is updated daily on week days.
Initial download of the metrics may take a while.