Fig. 5
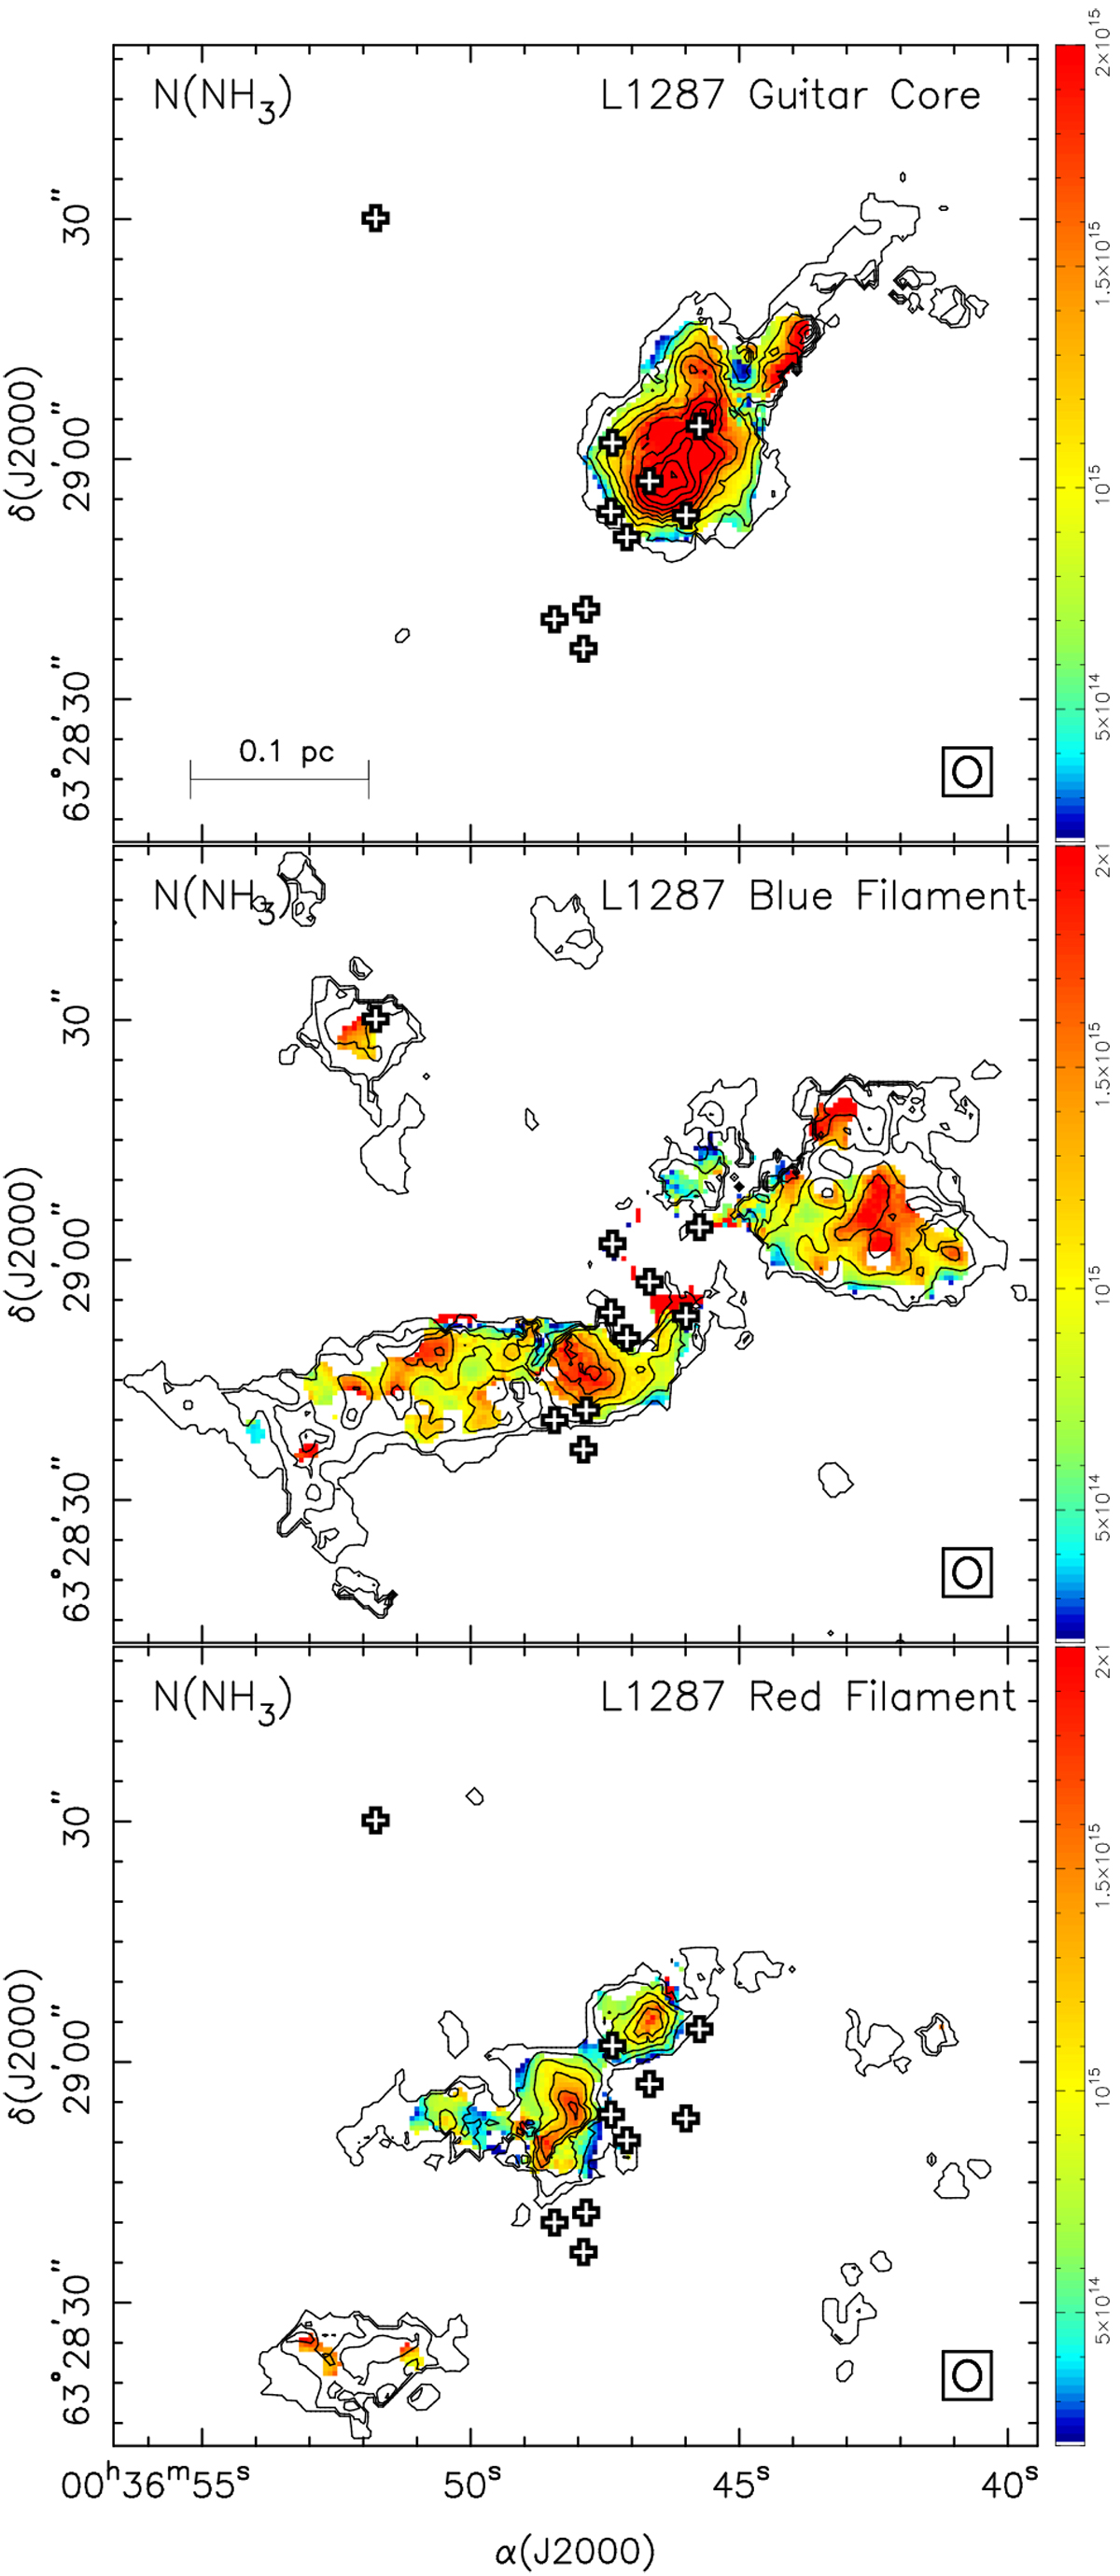
L1287 NH3 beam-averaged column density, corrected for primary beam response, derived from NH3 (1, 1) and (2, 2), assuming a beam filling factor f = 1 (color scale).The color scale ranges from 2 × 1014 cm−2 (blue) to 2 × 1015 cm−2 (red). The contours are the NH3 (1, 1) integrated line intensity, corrected for opacity, AτmΔV, of the Guitar core (top, velocity range − 20.16 to − 18.31 km s−1), RNO 1 and blue filament (middle, − 18.31 to − 17.07 km s−1), and red filament (bottom, − 17.07 to − 14.60 km s−1). Contours are from 1 to 37 in steps of 4K km s−1. The crosses correspond to the YSOs identified in Fig. 3.
Current usage metrics show cumulative count of Article Views (full-text article views including HTML views, PDF and ePub downloads, according to the available data) and Abstracts Views on Vision4Press platform.
Data correspond to usage on the plateform after 2015. The current usage metrics is available 48-96 hours after online publication and is updated daily on week days.
Initial download of the metrics may take a while.