Fig. 3
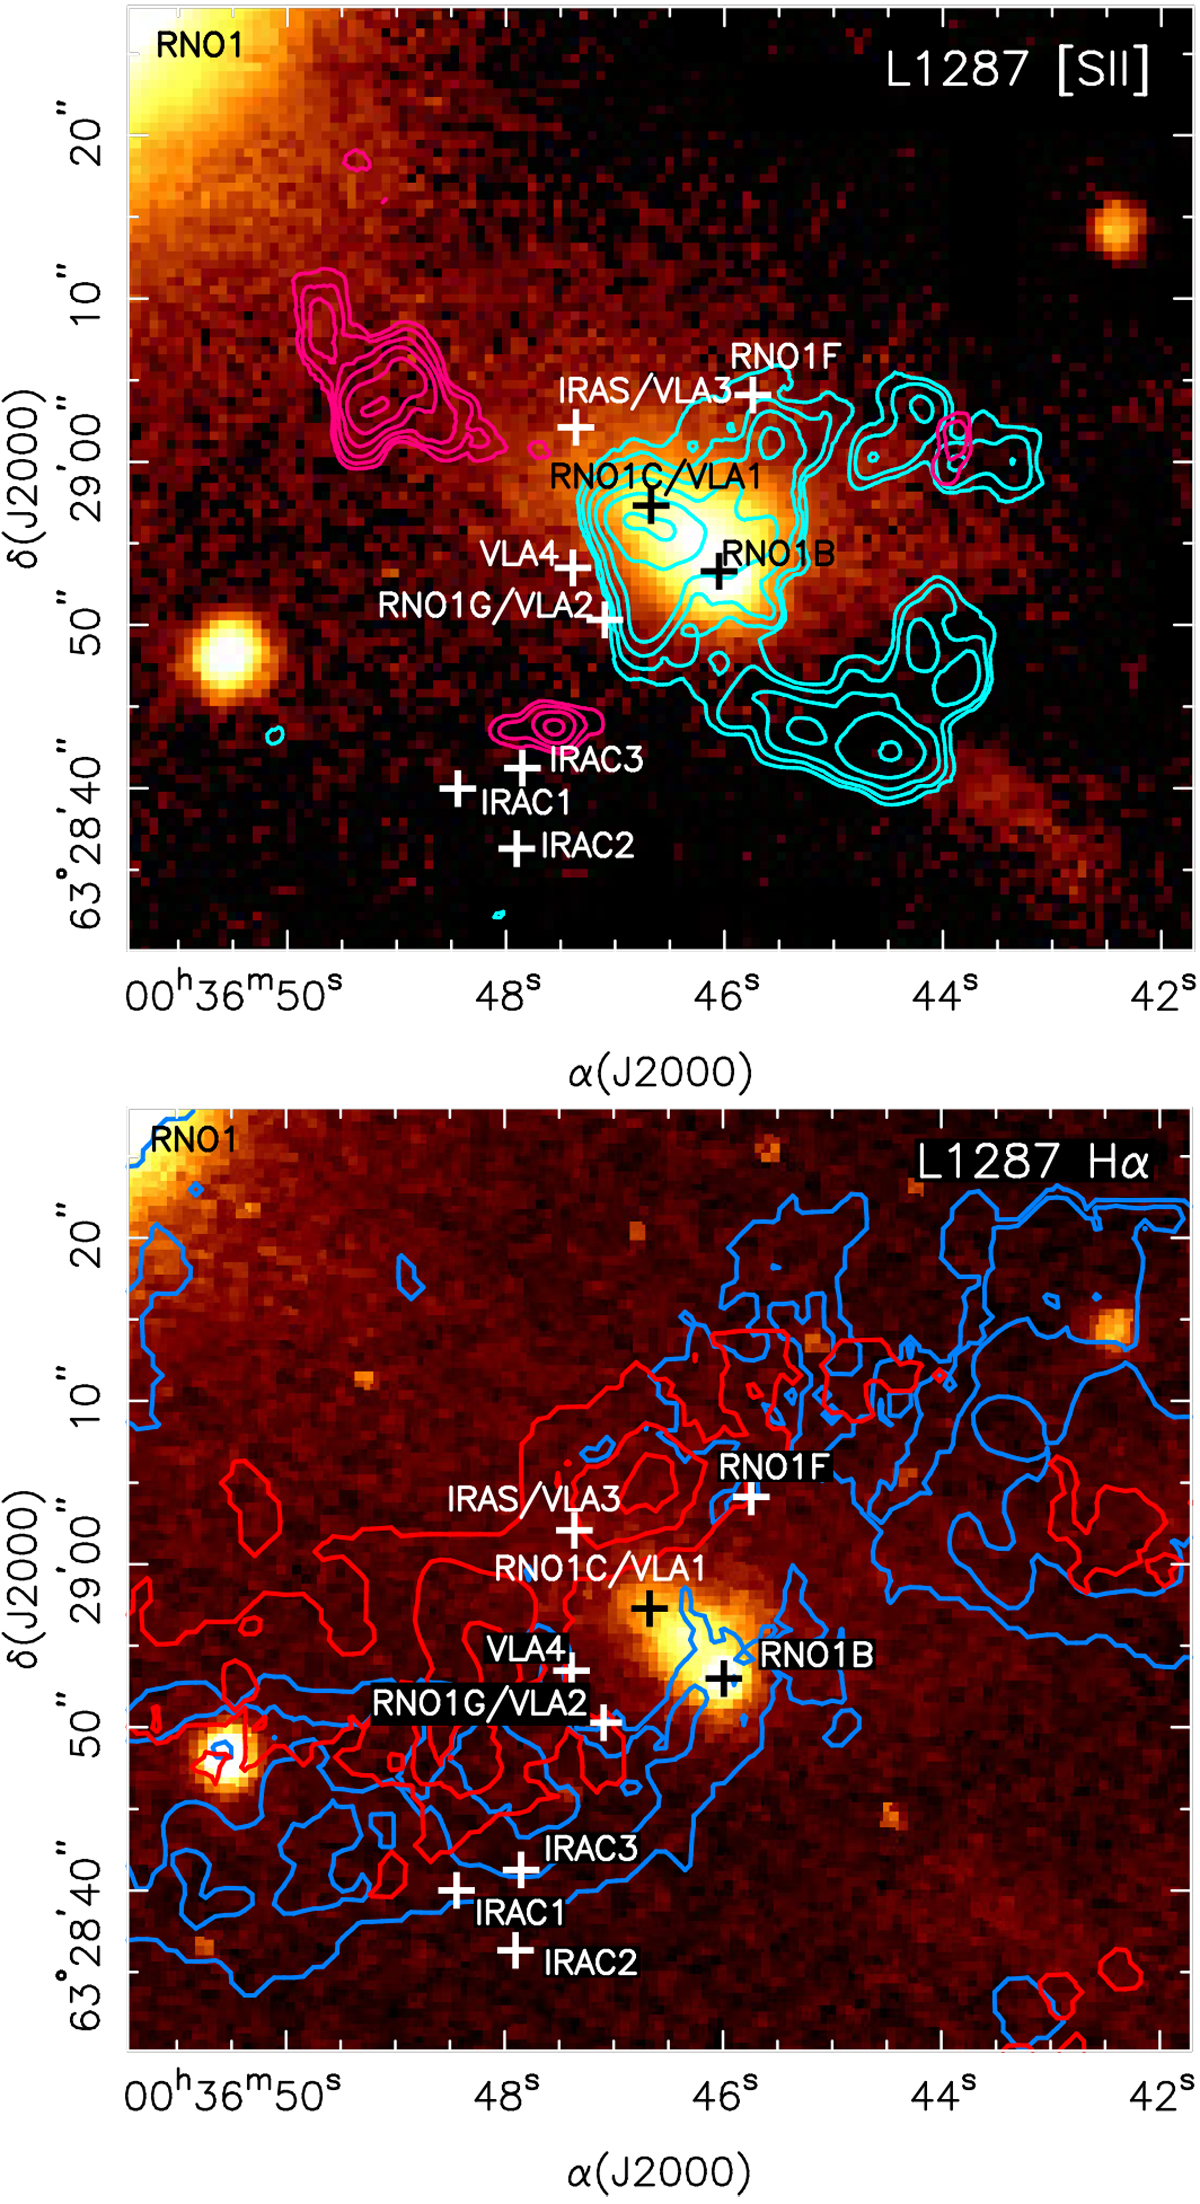
Images of L1287 obtained with the CAHA 2.2 m telescope. The IR and centimeter continuum sources and their positions are identified with black and white crosses (depending on the light or dark background) Top: [SII] (color scale); the blue and red contours show the small-scale CO outflow observed by Juárez et al. (2019). Bottom: Hα (color scale);contours show the integrated line emission of NH3 (1, 1) from the blue and red filaments (this work).
Current usage metrics show cumulative count of Article Views (full-text article views including HTML views, PDF and ePub downloads, according to the available data) and Abstracts Views on Vision4Press platform.
Data correspond to usage on the plateform after 2015. The current usage metrics is available 48-96 hours after online publication and is updated daily on week days.
Initial download of the metrics may take a while.