Free Access
Fig. A.5
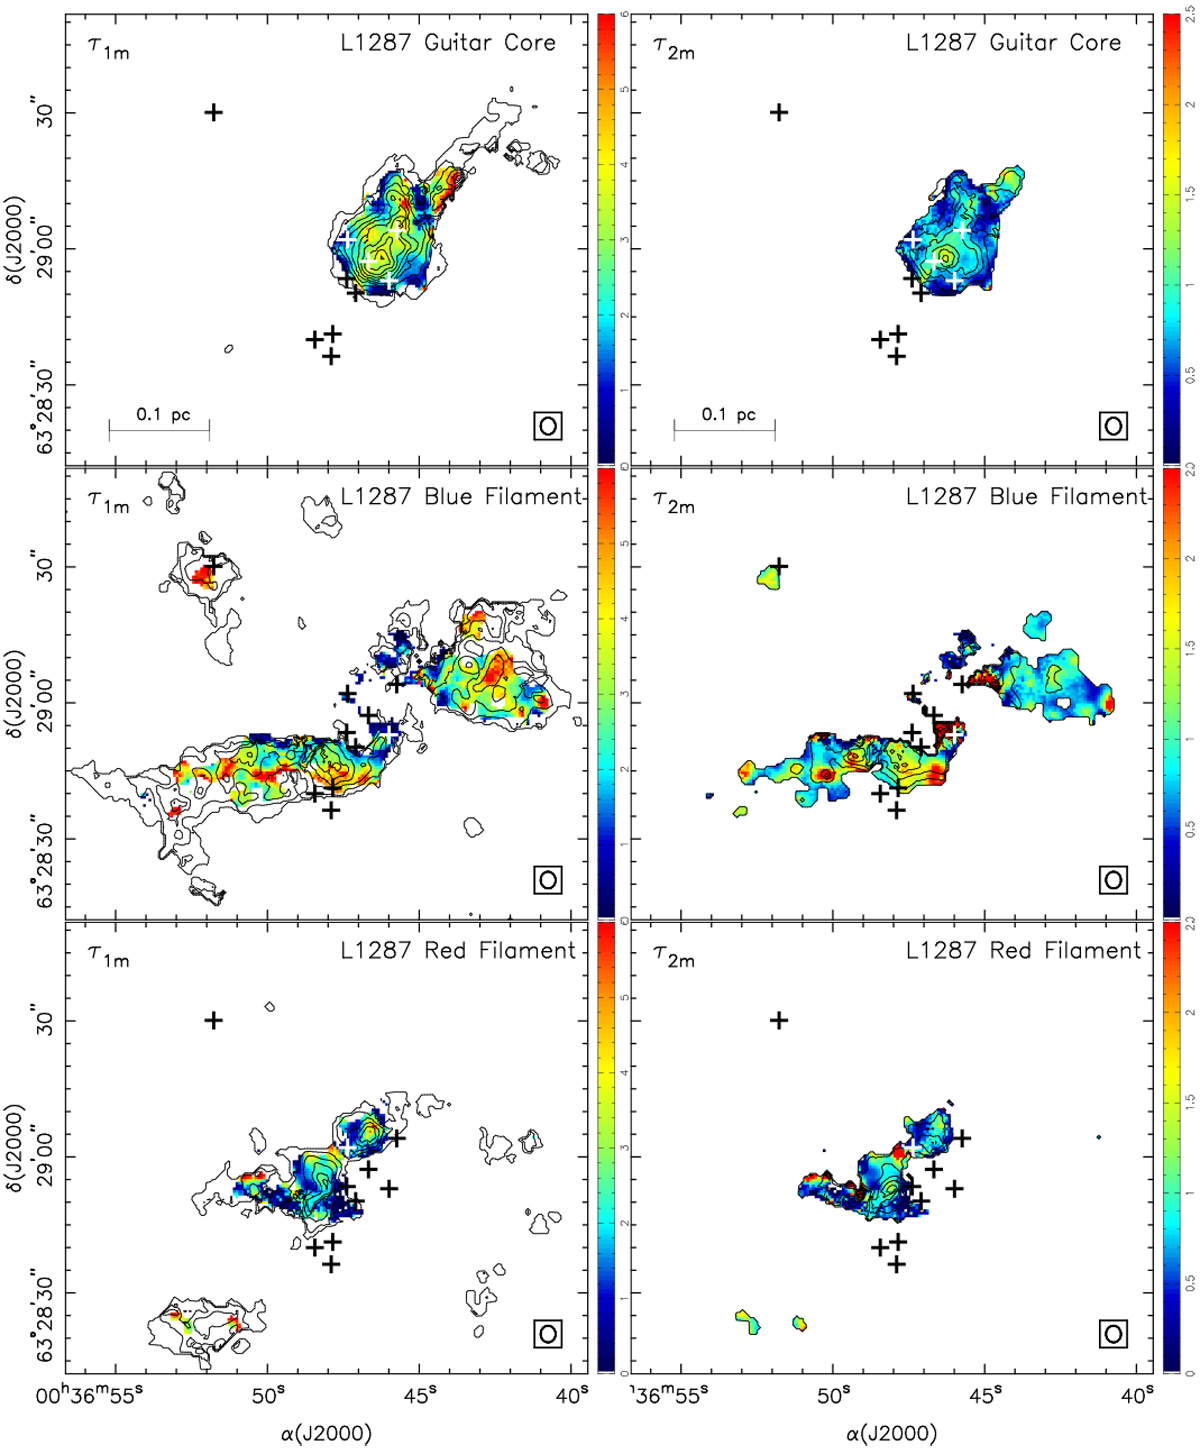
L1287 NH3 (1, 1) (left) and (2, 2) (right) main line optical depths, τ1m and τ2m. The color scale ranges from 0 to 6 for τ1m and from 0 to 2.5 for τ2m. The contours are the (1, 1) (left) and (2, 2) (right) integrated line intensities. The crosses correspond to the YSOs identified in Fig. 3.
Current usage metrics show cumulative count of Article Views (full-text article views including HTML views, PDF and ePub downloads, according to the available data) and Abstracts Views on Vision4Press platform.
Data correspond to usage on the plateform after 2015. The current usage metrics is available 48-96 hours after online publication and is updated daily on week days.
Initial download of the metrics may take a while.