Fig. 17
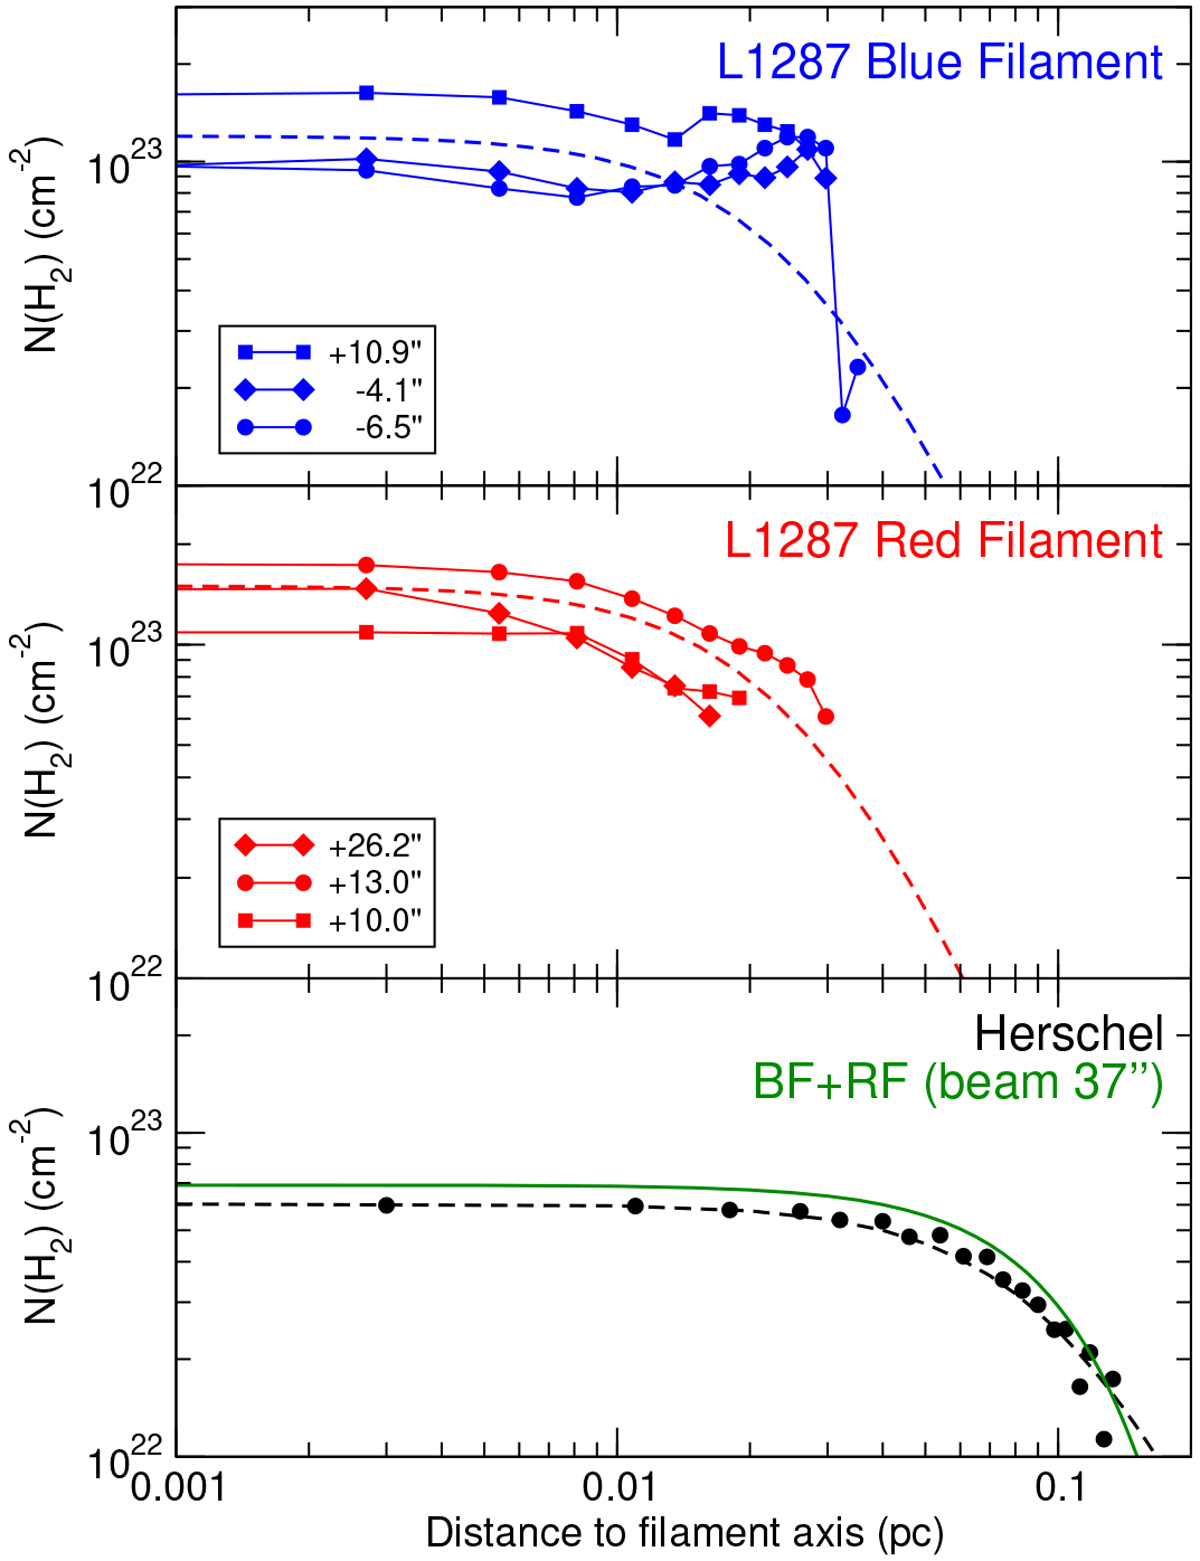
Hydrogen column density as a function of distance to the filament axis, for three positions along the blue filament, at position offsets −6′′.5, −4′′.1, +10′′.9 (top panel), and along the red filament, at position offsets +10′′.0, +13′′.0, +20′′.2 (middle panel). The axes of the filaments are taken as the central lines of the slices used in Fig. 18. The blue and red dashed lines represent the self-gravitating isothermal filament models fitted for the blue and red filament data (see Table 3). The bottom panel shows the H2 column density from Herschel (Juárez et al. 2019) (black filled circles) and the self-gravitating isothermal filament model fit to the Herschel data (black dashed line). The green continuum line is the sumof the models for the blue and red filaments, convolved with the Herschel beam (FWHM = 37″).
Current usage metrics show cumulative count of Article Views (full-text article views including HTML views, PDF and ePub downloads, according to the available data) and Abstracts Views on Vision4Press platform.
Data correspond to usage on the plateform after 2015. The current usage metrics is available 48-96 hours after online publication and is updated daily on week days.
Initial download of the metrics may take a while.