Fig. 13
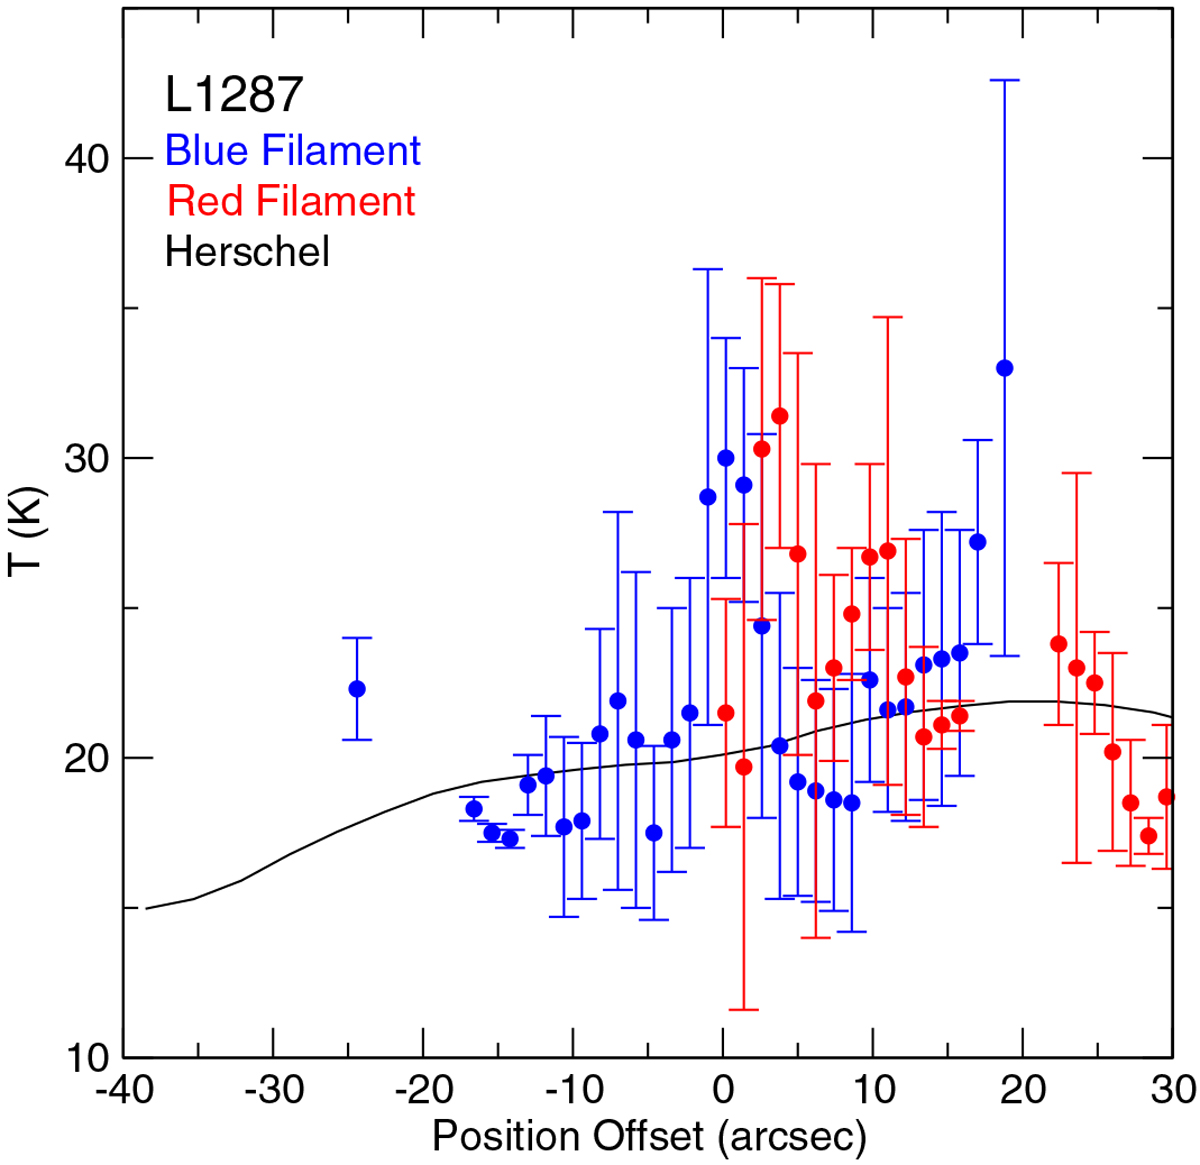
Kinetic temperature derived from the NH3 data as a function of position along the blue filament (blue dots) and the red filament (red dots). Each data point is the median value of the kinetic temperature for points across the filament for a given position along the filament. The error bars indicate the median of the uncertainty. The dust temperature from Herschel data (Juárez et al. 2019) (beam size 37″), for a slice encompassing both filaments, is shown as a black solid line.
Current usage metrics show cumulative count of Article Views (full-text article views including HTML views, PDF and ePub downloads, according to the available data) and Abstracts Views on Vision4Press platform.
Data correspond to usage on the plateform after 2015. The current usage metrics is available 48-96 hours after online publication and is updated daily on week days.
Initial download of the metrics may take a while.