Fig. 12
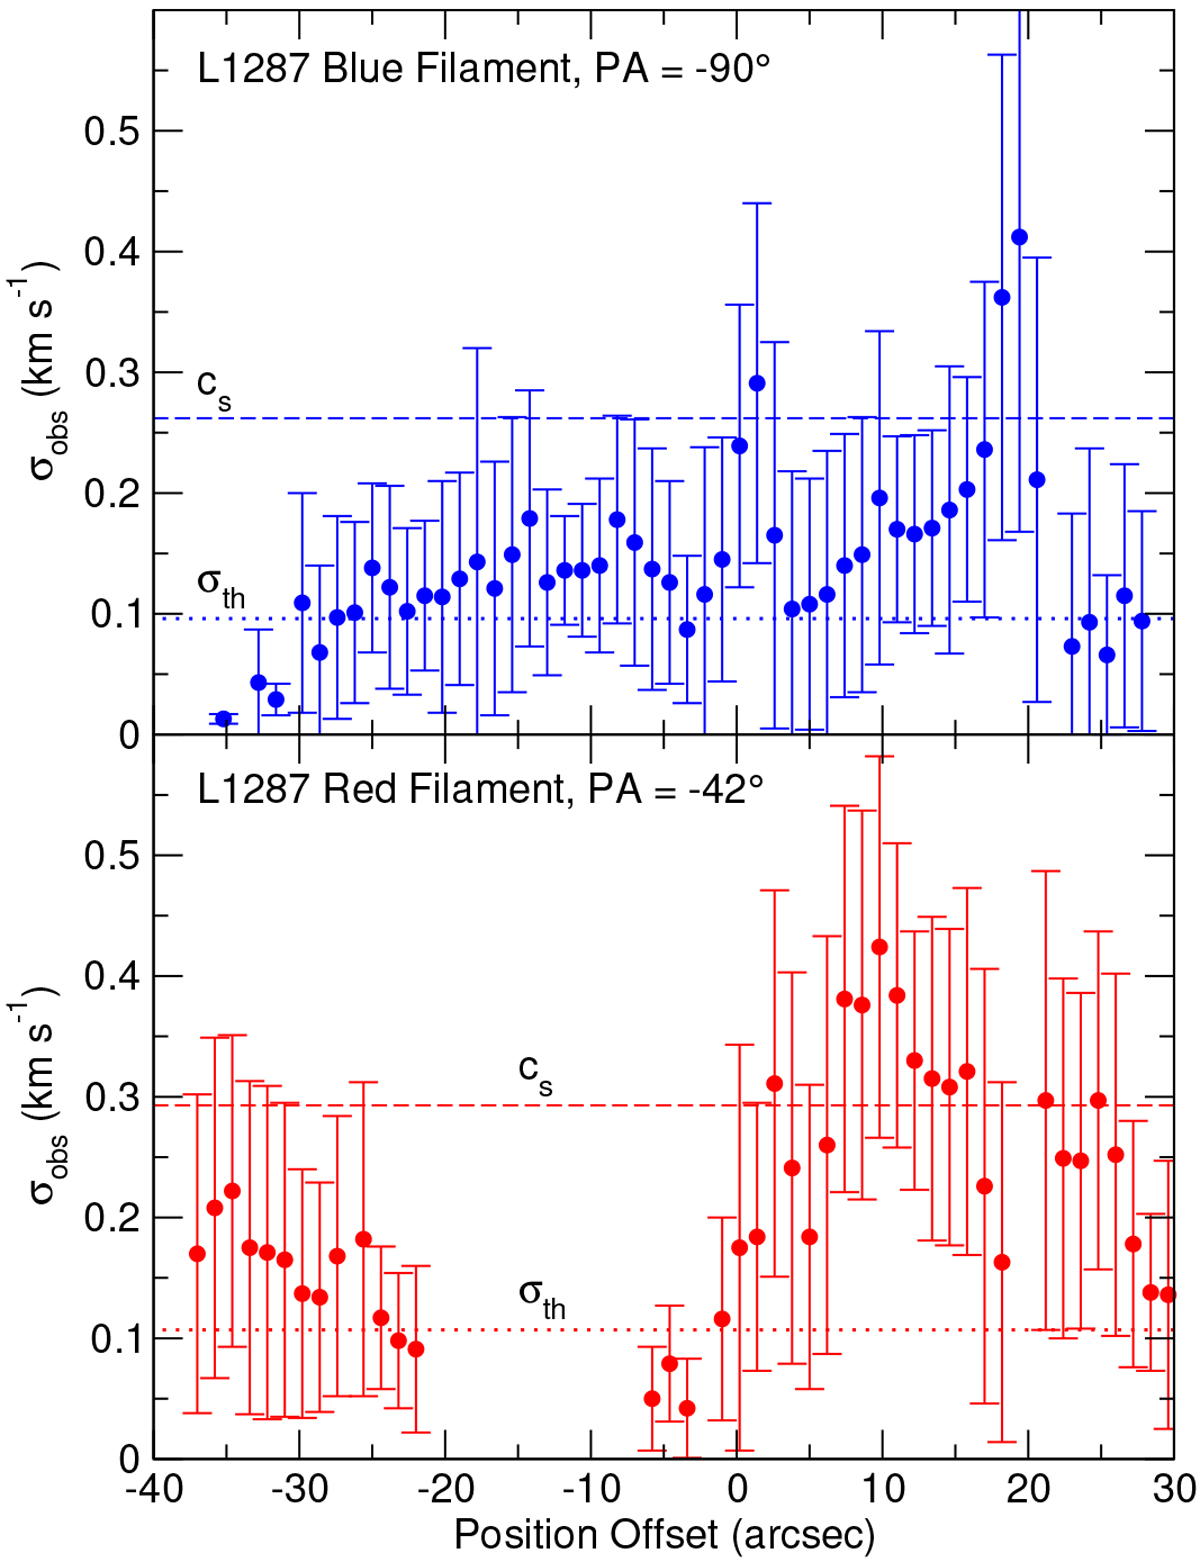
NH3 velocity dispersion, ![]() , as a function of position along the blue filament (blue dots) and the red filament (red dots). Each data point is the median value of the velocity dispersion for the points across the filament for a given position along the filament, and the error bars indicate the median of the uncertainty of the values of the velocity dispersion for the same points. The dashed lines indicate the average sound speed,
cs, of the filaments, 0.26 km s−1 (blue filament) and 0.29 km s−1 (red filament), and the dotted lines indicate average thermal width (see text), 0.10 km s−1 (blue filament) and 0.11 km s−1 (red filament). The slices used are the same as in Fig. 11.
, as a function of position along the blue filament (blue dots) and the red filament (red dots). Each data point is the median value of the velocity dispersion for the points across the filament for a given position along the filament, and the error bars indicate the median of the uncertainty of the values of the velocity dispersion for the same points. The dashed lines indicate the average sound speed,
cs, of the filaments, 0.26 km s−1 (blue filament) and 0.29 km s−1 (red filament), and the dotted lines indicate average thermal width (see text), 0.10 km s−1 (blue filament) and 0.11 km s−1 (red filament). The slices used are the same as in Fig. 11.
Current usage metrics show cumulative count of Article Views (full-text article views including HTML views, PDF and ePub downloads, according to the available data) and Abstracts Views on Vision4Press platform.
Data correspond to usage on the plateform after 2015. The current usage metrics is available 48-96 hours after online publication and is updated daily on week days.
Initial download of the metrics may take a while.