Fig. 11
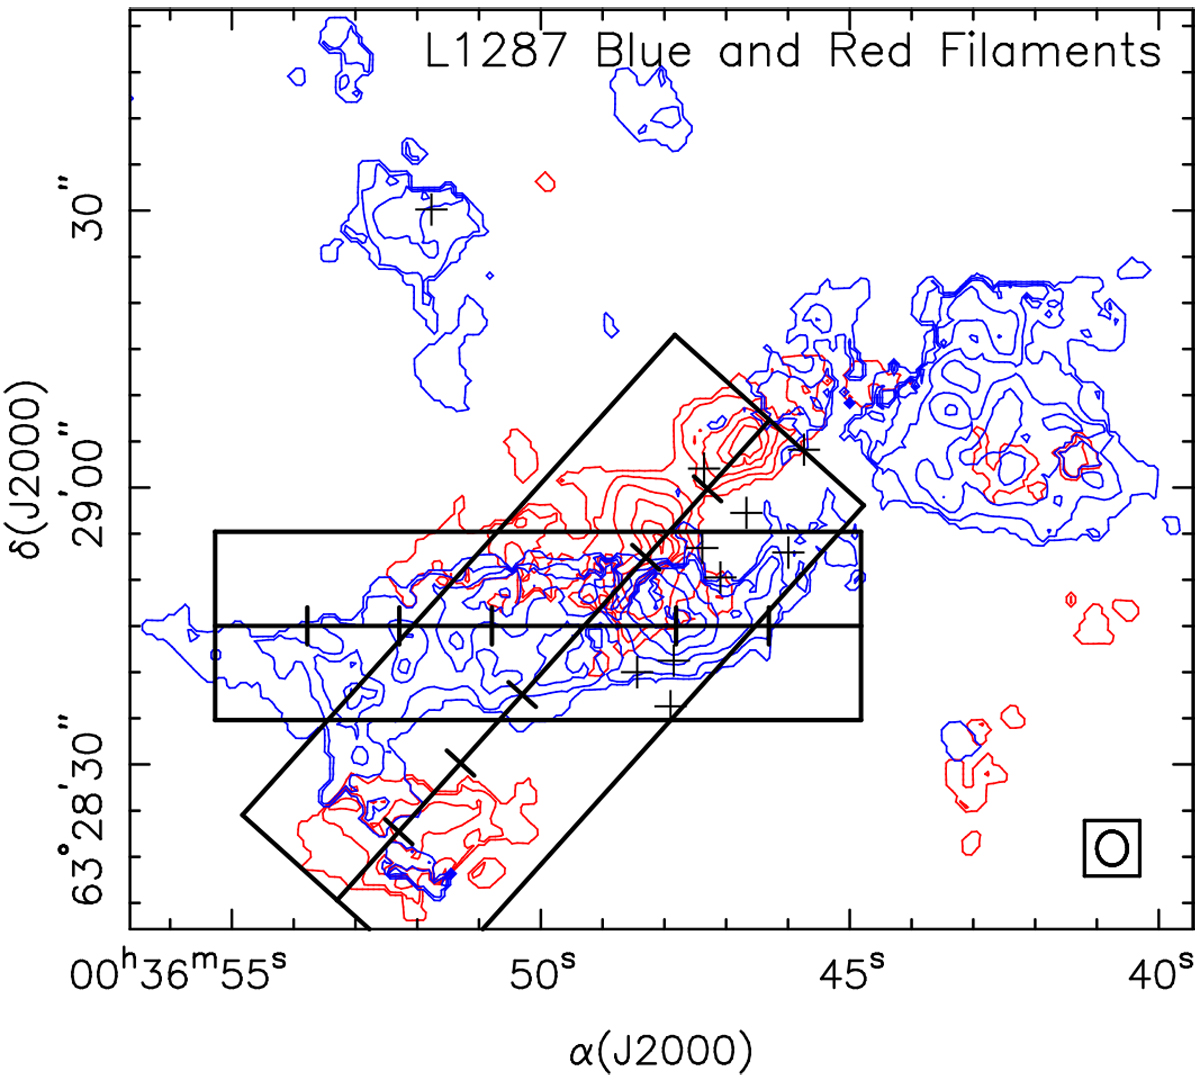
Slices used to analyze the filaments, superimposed on the integrated line intensity, corrected for opacity, Aτm ΔV, of the blue filament (blue contours) and the red filament (red contours). The origin of offsets along the filaments is taken at the position of the intersection of the two slices, and increase toward the west (blue filament) and the northwest (red filament) from − 40″ to + 30″. Ticks in the central line of the slices are at intervals of 10″.
Current usage metrics show cumulative count of Article Views (full-text article views including HTML views, PDF and ePub downloads, according to the available data) and Abstracts Views on Vision4Press platform.
Data correspond to usage on the plateform after 2015. The current usage metrics is available 48-96 hours after online publication and is updated daily on week days.
Initial download of the metrics may take a while.