Fig. 1
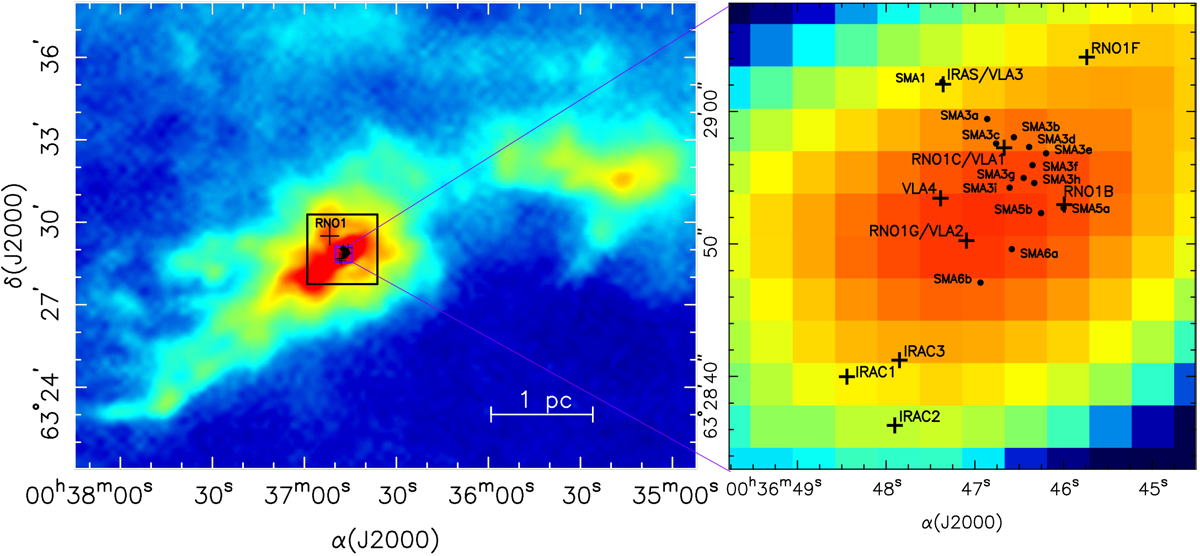
Herschel large-scale map (left) of H2 column density (Juárez et al. 2019). The large-scale filament, roughly in the southeast–northwest direction, can be clearly seen. The large box shows the region mapped in NH3, encompassing the area of highest column density of the filament. The embedded sources detected in the IR, millimeter, and centimeter continuum are identified in the enlarged view (right) of the small box in the central area (except RNO 1, which lies outside the small box). The black dots (•) in the right panel correspond to millimeter dust-continuum emission (Juárez et al. 2019), and the plus signs (+) to mid-IR sources (Quanz et al. 2007) and centimeter continuum sources (Anglada et al. 1994).
Current usage metrics show cumulative count of Article Views (full-text article views including HTML views, PDF and ePub downloads, according to the available data) and Abstracts Views on Vision4Press platform.
Data correspond to usage on the plateform after 2015. The current usage metrics is available 48-96 hours after online publication and is updated daily on week days.
Initial download of the metrics may take a while.