Fig. 1.
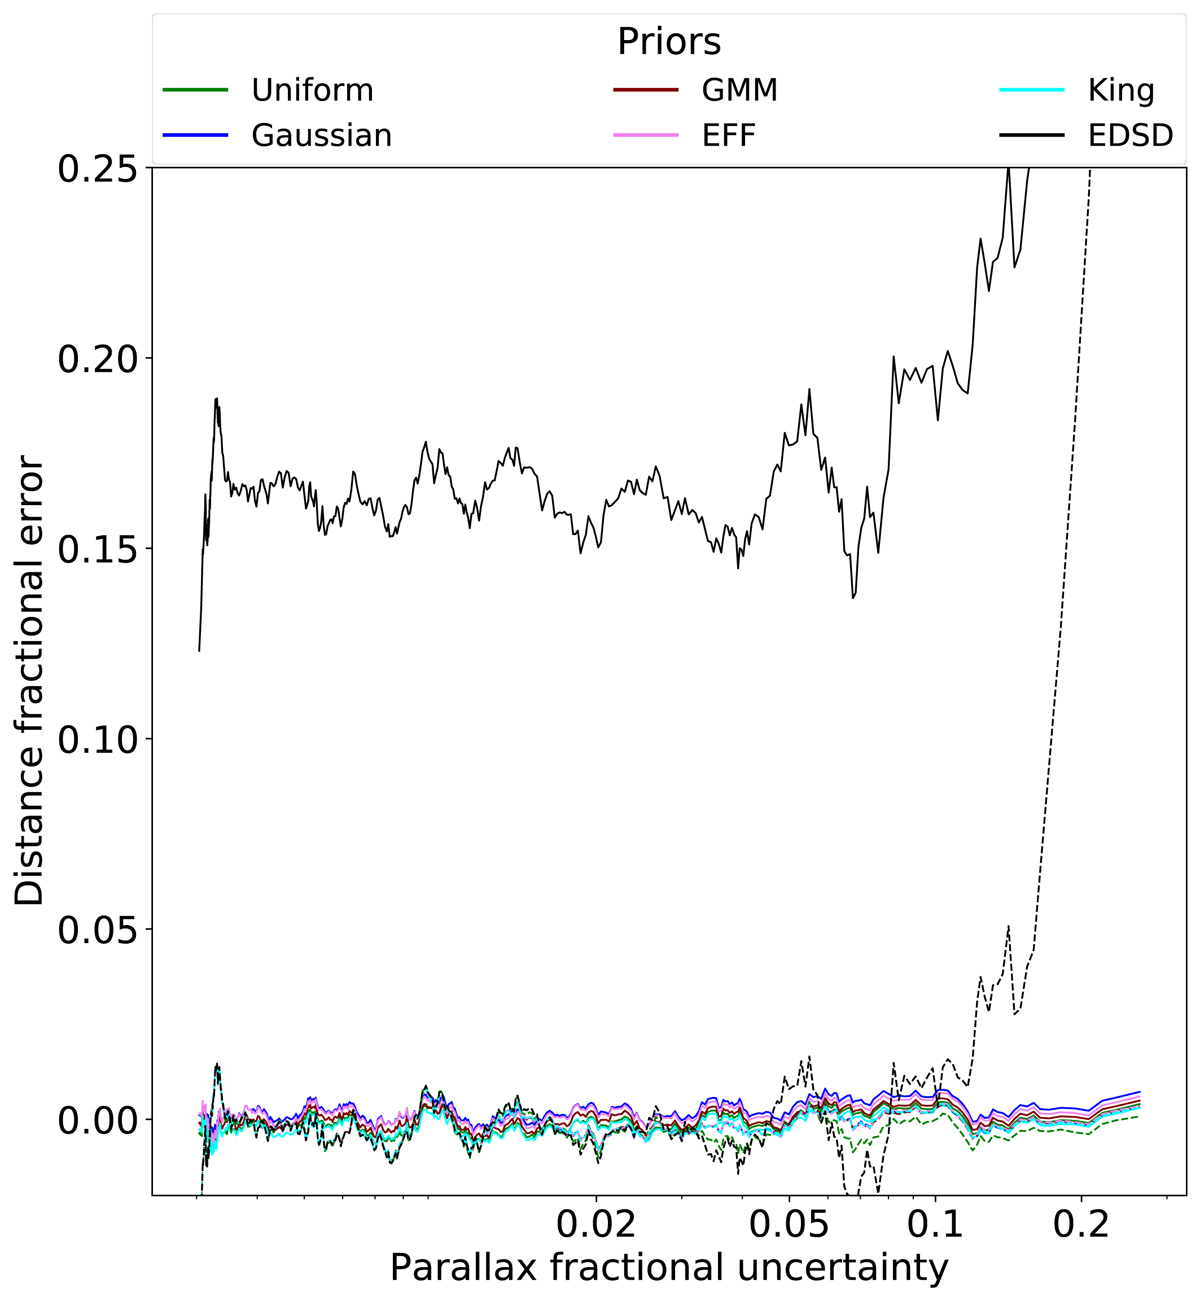
Distance fractional error as a function of parallax fractional uncertainty. The inference was done using all our prior families (color coded) on a synthetic cluster with 500 stars located at 500 pc. The lines show the rolling mean (computed with a window of 20 sources) of results obtained including (solid line) and neglecting (dashed lines) the parallax spatial correlations.
Current usage metrics show cumulative count of Article Views (full-text article views including HTML views, PDF and ePub downloads, according to the available data) and Abstracts Views on Vision4Press platform.
Data correspond to usage on the plateform after 2015. The current usage metrics is available 48-96 hours after online publication and is updated daily on week days.
Initial download of the metrics may take a while.