Fig. 3.
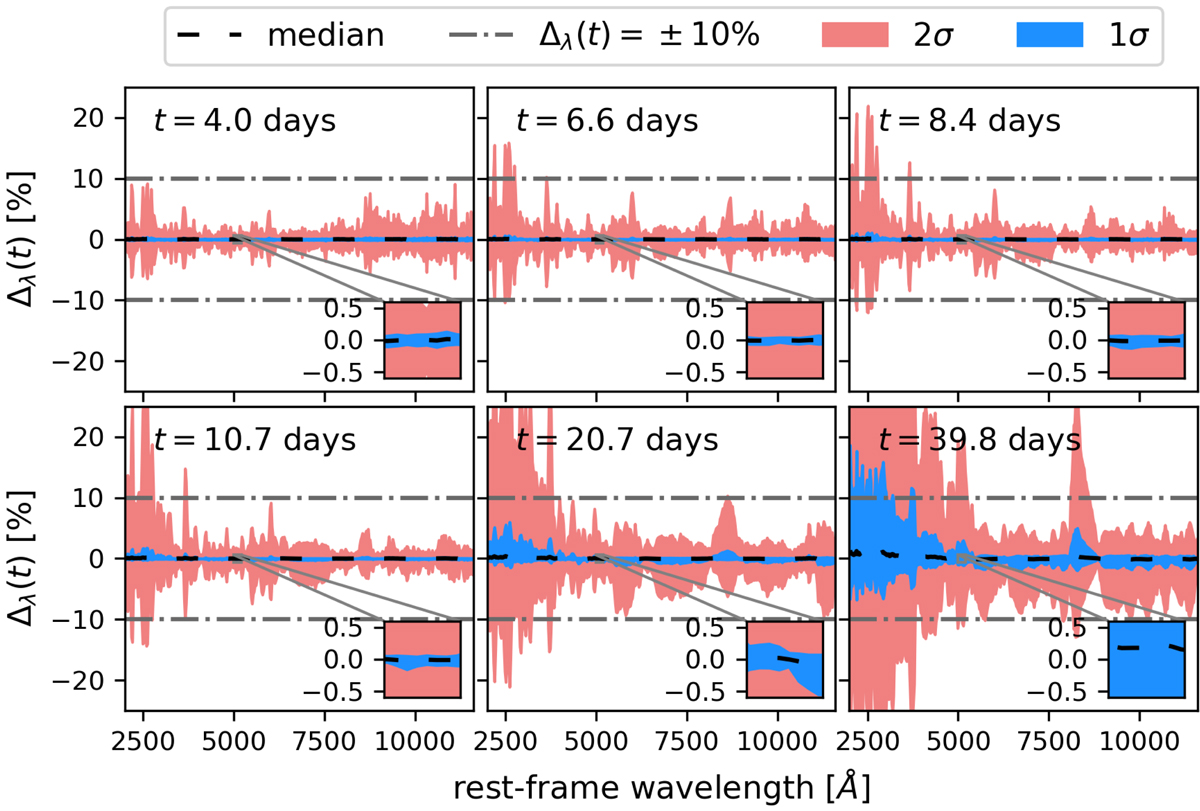
Deviations Δλ(t) of the N100 SN Ia spectra due to microlensing for different times after explosion. The panels and labels are in the same format as in Fig. 2. In the early phase (≲10 rest-frame days after explosion), the 1σ range of the deviation is within 1% and most of the 2σ range is within 10% except in the UV, where the 2σ range could reach ∼20% owing to the early suppression of UV flux in N100.
Current usage metrics show cumulative count of Article Views (full-text article views including HTML views, PDF and ePub downloads, according to the available data) and Abstracts Views on Vision4Press platform.
Data correspond to usage on the plateform after 2015. The current usage metrics is available 48-96 hours after online publication and is updated daily on week days.
Initial download of the metrics may take a while.