Fig. 2.
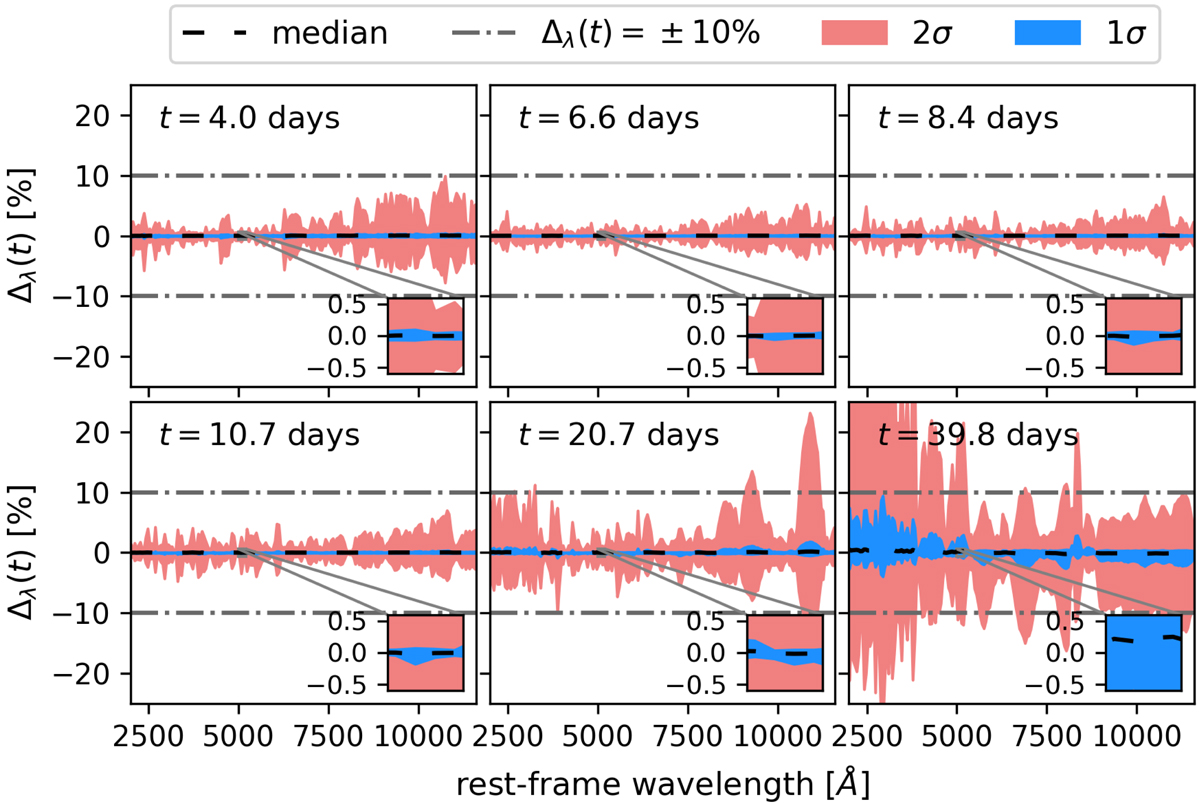
Deviations (Δλ(t), see Eq. (2)) of the W7 SN Ia spectra due to microlensing for different times after explosion. The black dashed line represents the median, and the 1σ and 2σ spreads are shown in blue and red shades, respectively, for a sample of 30 different magnification maps with 10 000 random positions per map. The grey dot-dashed line indicates a deviation of 10% in the spectra relative to the intrinsic spectrum without microlensing effects. The small zoomed-in panels show a region of 150 Å to illustrate the small extent of the 1σ spread especially at early times. In the early phases within ∼10 rest-frame days after explosion, the 2σ ranges of the deviations are within 10%.
Current usage metrics show cumulative count of Article Views (full-text article views including HTML views, PDF and ePub downloads, according to the available data) and Abstracts Views on Vision4Press platform.
Data correspond to usage on the plateform after 2015. The current usage metrics is available 48-96 hours after online publication and is updated daily on week days.
Initial download of the metrics may take a while.