Open Access
Fig. D.1.
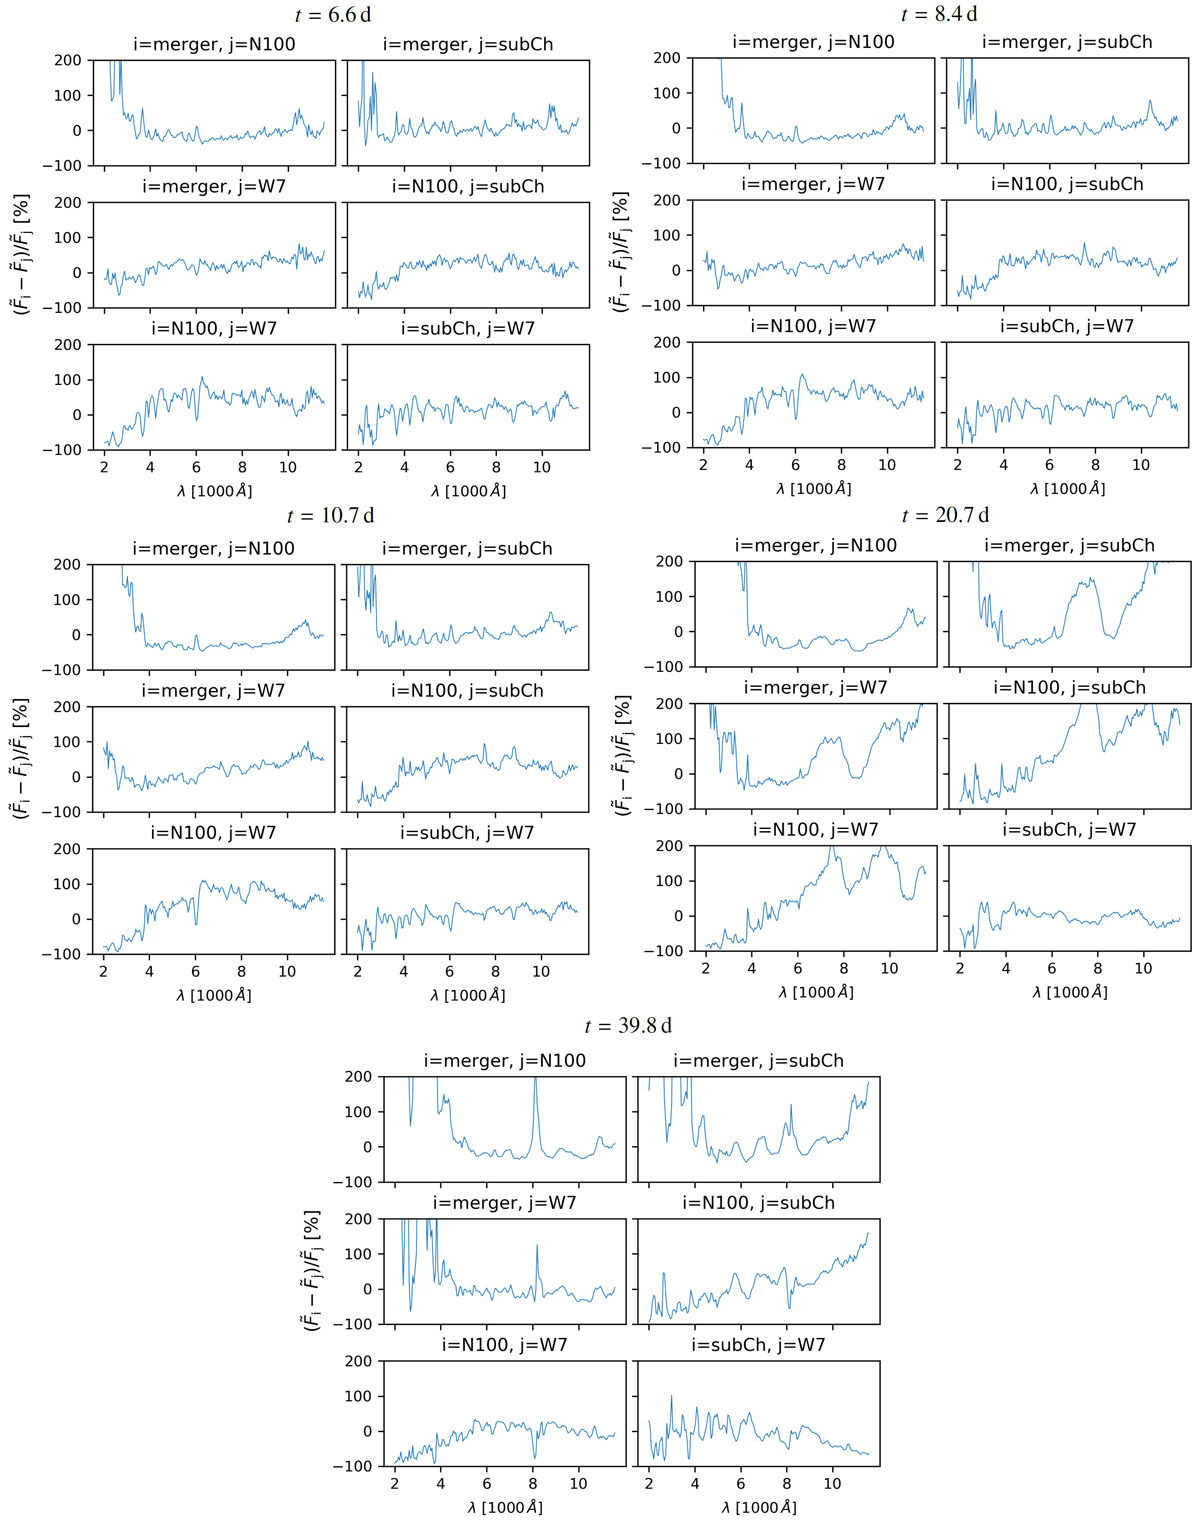
Deviations Δλ(t) between pairs of SN Ia spectra from the four SN models (W7, N100, subCh, and merger) at five different rest-frame times t after explosion, as indicated on top of each panel. The panels and labels are in the same format as in Fig. 6.
Current usage metrics show cumulative count of Article Views (full-text article views including HTML views, PDF and ePub downloads, according to the available data) and Abstracts Views on Vision4Press platform.
Data correspond to usage on the plateform after 2015. The current usage metrics is available 48-96 hours after online publication and is updated daily on week days.
Initial download of the metrics may take a while.