Fig. B.1.
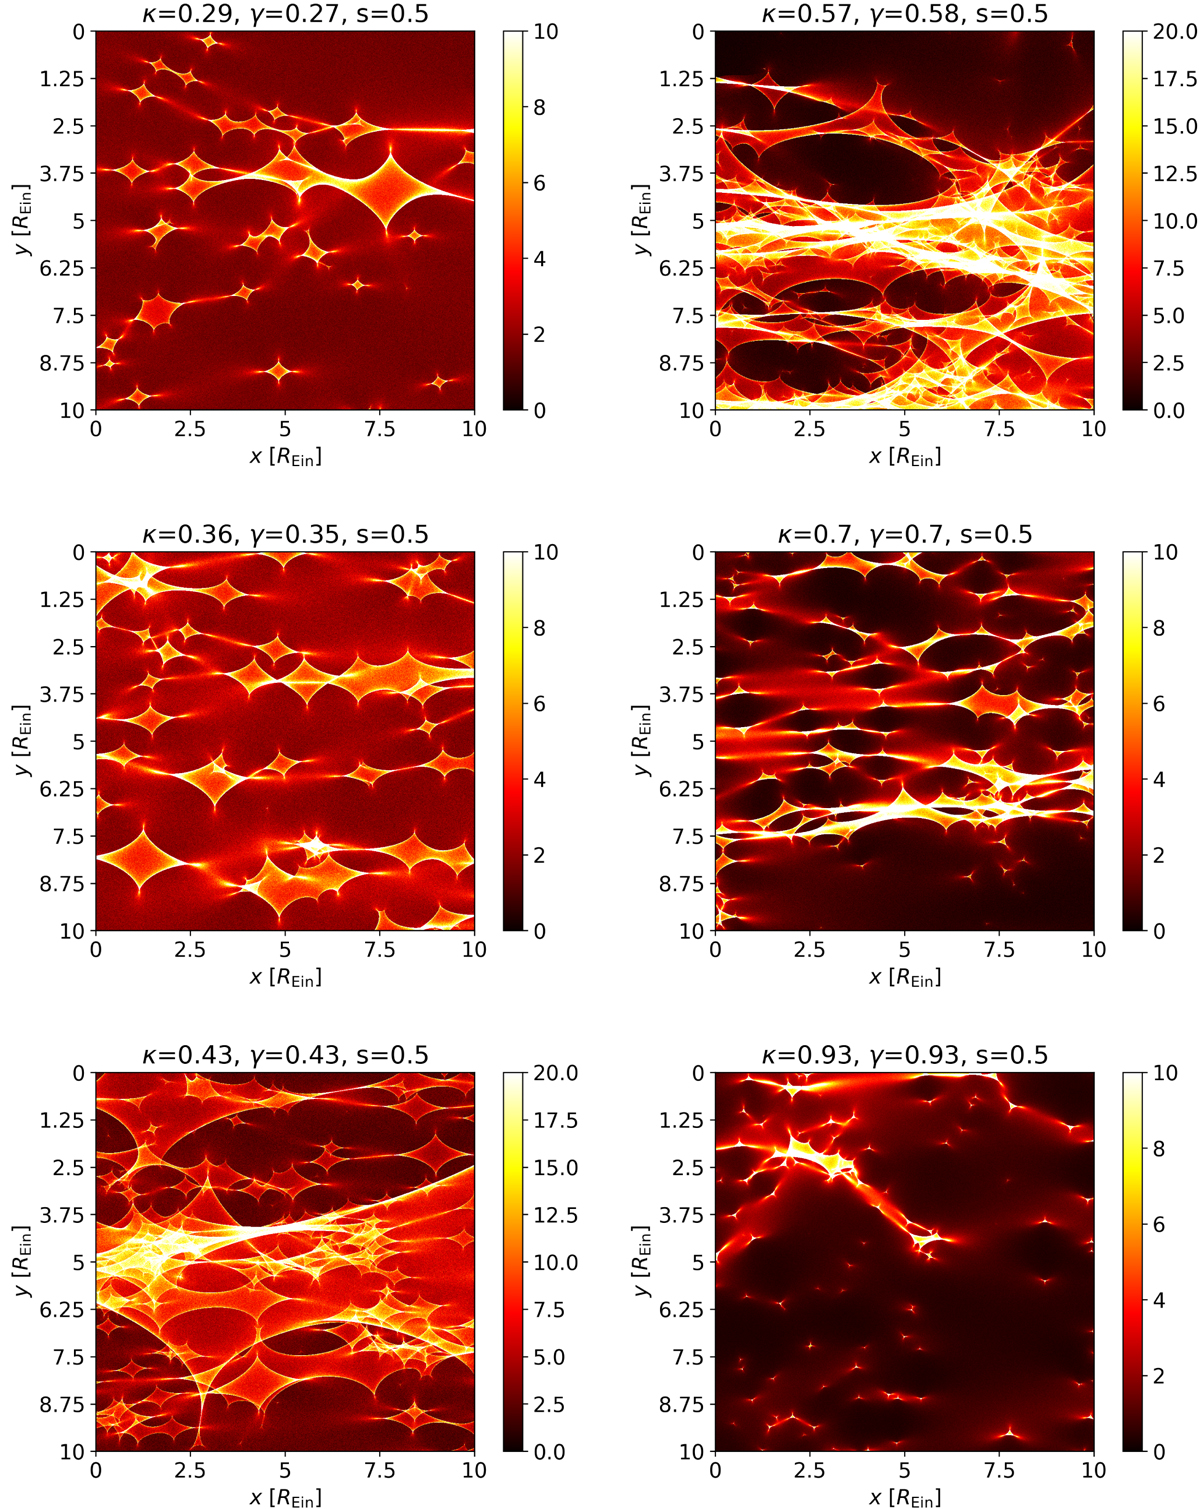
Magnification maps for six different (κ, γ) pairs for s = 0.5. The colour scale indicates for each panel the magnification factor μ(x, y). The panels on the left-hand side correspond to type I lensing images (time-delay minimum images) and the panels on the right-hand side to type II lensing images (time-delay saddle images).8 In all panels, many micro caustics are present, separating low- and high-magnification areas.
Current usage metrics show cumulative count of Article Views (full-text article views including HTML views, PDF and ePub downloads, according to the available data) and Abstracts Views on Vision4Press platform.
Data correspond to usage on the plateform after 2015. The current usage metrics is available 48-96 hours after online publication and is updated daily on week days.
Initial download of the metrics may take a while.