Fig. 1.
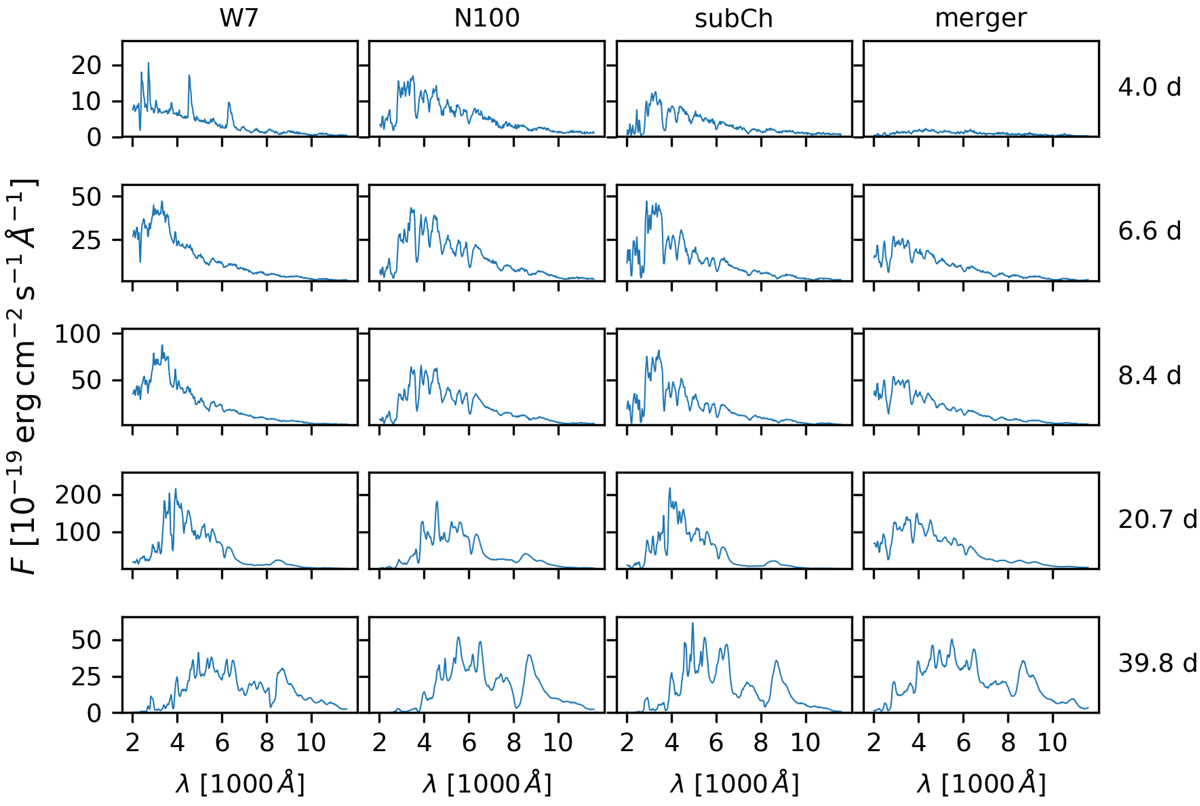
Spectral evolution of four different SNe Ia explosion models in rest-frame wavelengths. Columns from left to right: W7, N100, subCh, and merger models. Rows from top to bottom: rest-frame time after explosion in days, as indicated on the right of each row. In early phases (≲10 days after explosions), the spectra of different SNe Ia models show distinguishing features that depend on assumptions in the radiative transfer calculations, whereas at later times the spectra from different models start to resemble one another.
Current usage metrics show cumulative count of Article Views (full-text article views including HTML views, PDF and ePub downloads, according to the available data) and Abstracts Views on Vision4Press platform.
Data correspond to usage on the plateform after 2015. The current usage metrics is available 48-96 hours after online publication and is updated daily on week days.
Initial download of the metrics may take a while.