Fig. 7
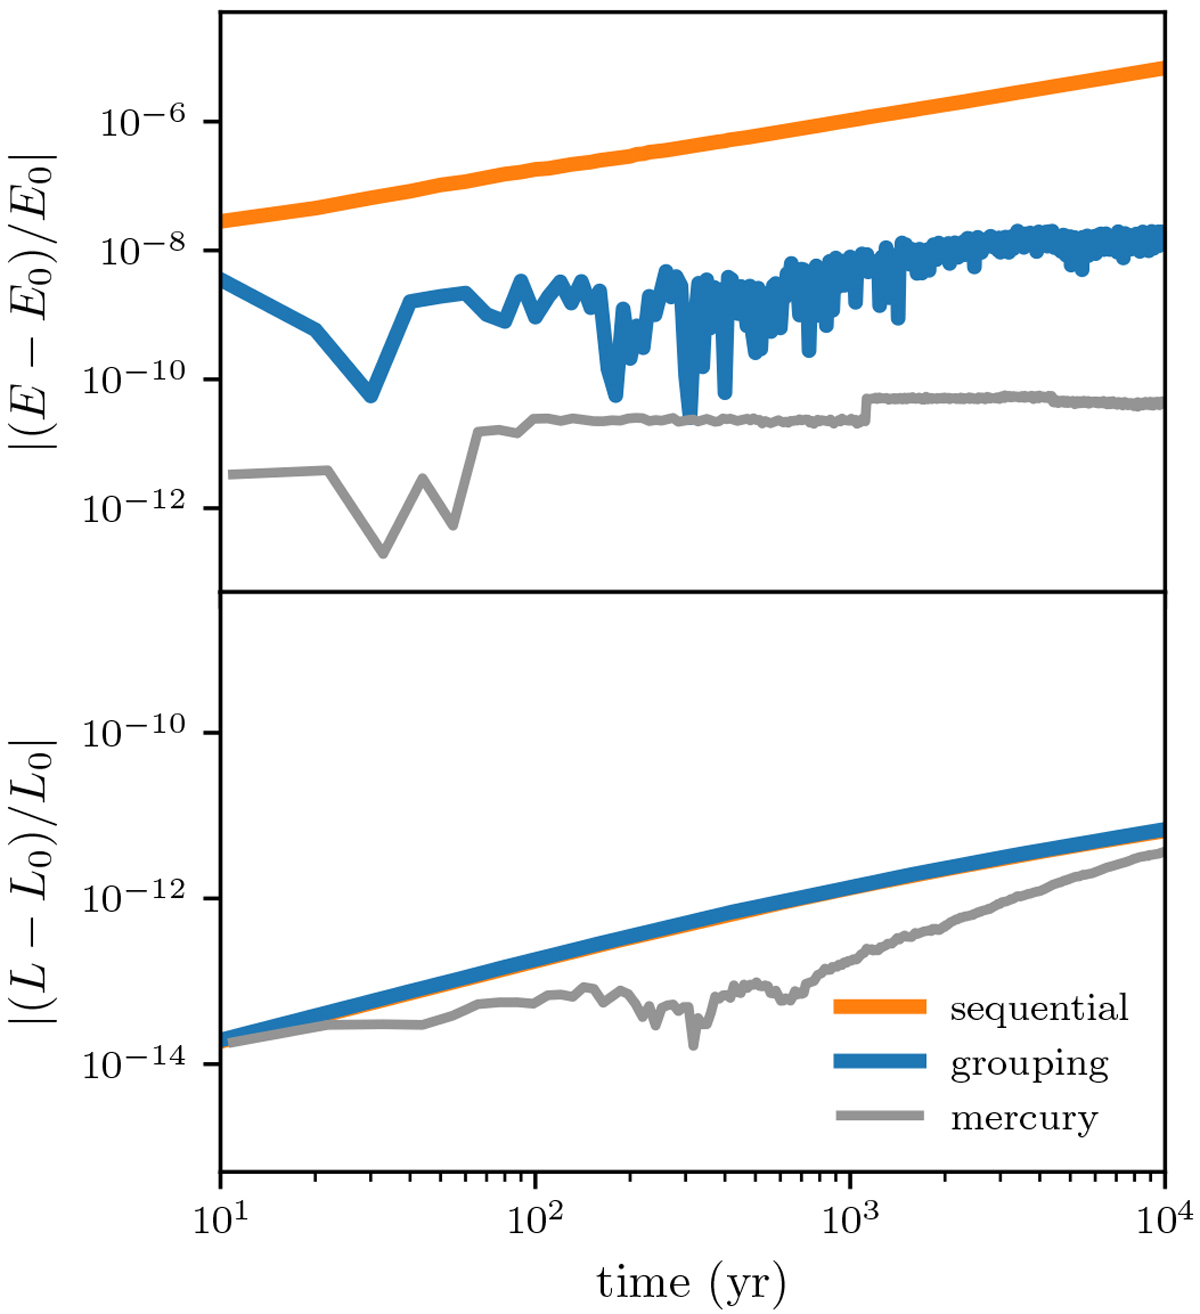
Energy and angular momentum. The figure shows the time evolution of the relative change of energy (top panel) and angular momentum (bottom panel) for equal-mass planetesimals. Shown are the results obtained with the sequential approach (sequential; orange) and the group approach (grouping; blue) of our method and compared with mercury (grey).
Current usage metrics show cumulative count of Article Views (full-text article views including HTML views, PDF and ePub downloads, according to the available data) and Abstracts Views on Vision4Press platform.
Data correspond to usage on the plateform after 2015. The current usage metrics is available 48-96 hours after online publication and is updated daily on week days.
Initial download of the metrics may take a while.