Fig. B.2
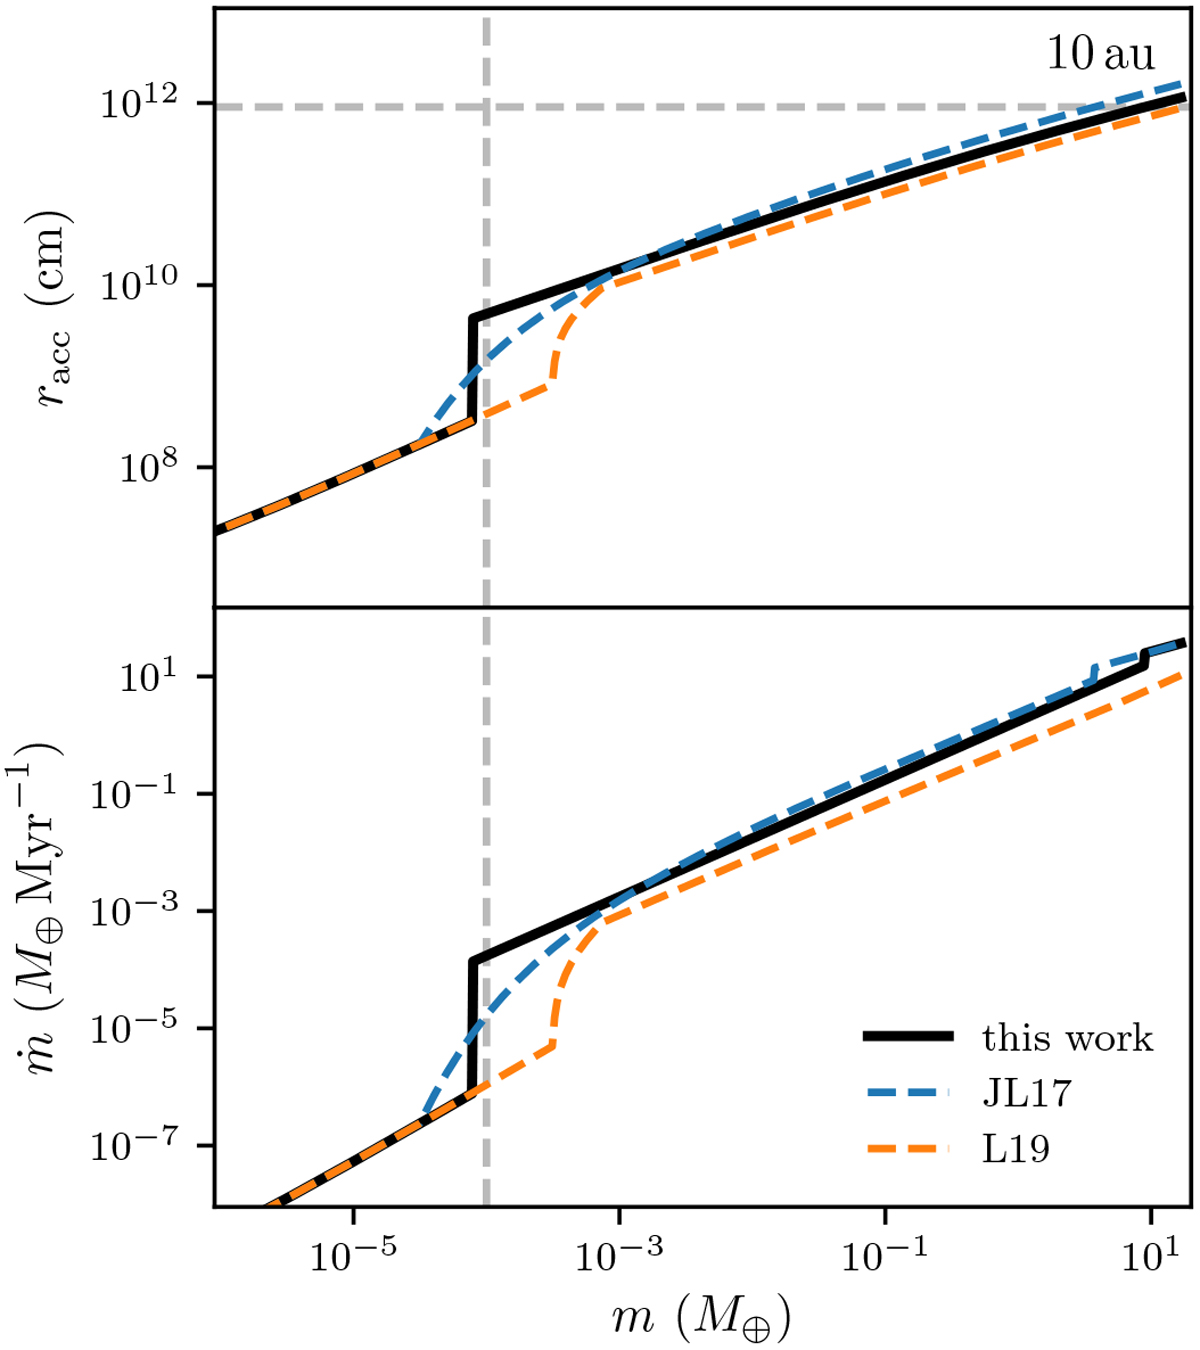
Accretion radius and mass accretion rate for pebble accretion at 10 au. Shown are racc (top panel) and ṁ (bottom panel) as a function of planetesimal mass. We compare our prescription (black solid line) to the models developed in Johansen & Lambrechts (2017; JL17, blue dashed line) and Lambrechts et al. (2019; L19, dashed orange line). The vertical dashed line indicates the initial mass of the planetesimals used in Sect. 3.8. The horizontal dashed line (top panel) is the pebble scale-height, which indicates the transition from 3D to 2D accretion.
Current usage metrics show cumulative count of Article Views (full-text article views including HTML views, PDF and ePub downloads, according to the available data) and Abstracts Views on Vision4Press platform.
Data correspond to usage on the plateform after 2015. The current usage metrics is available 48-96 hours after online publication and is updated daily on week days.
Initial download of the metrics may take a while.