Fig. 12
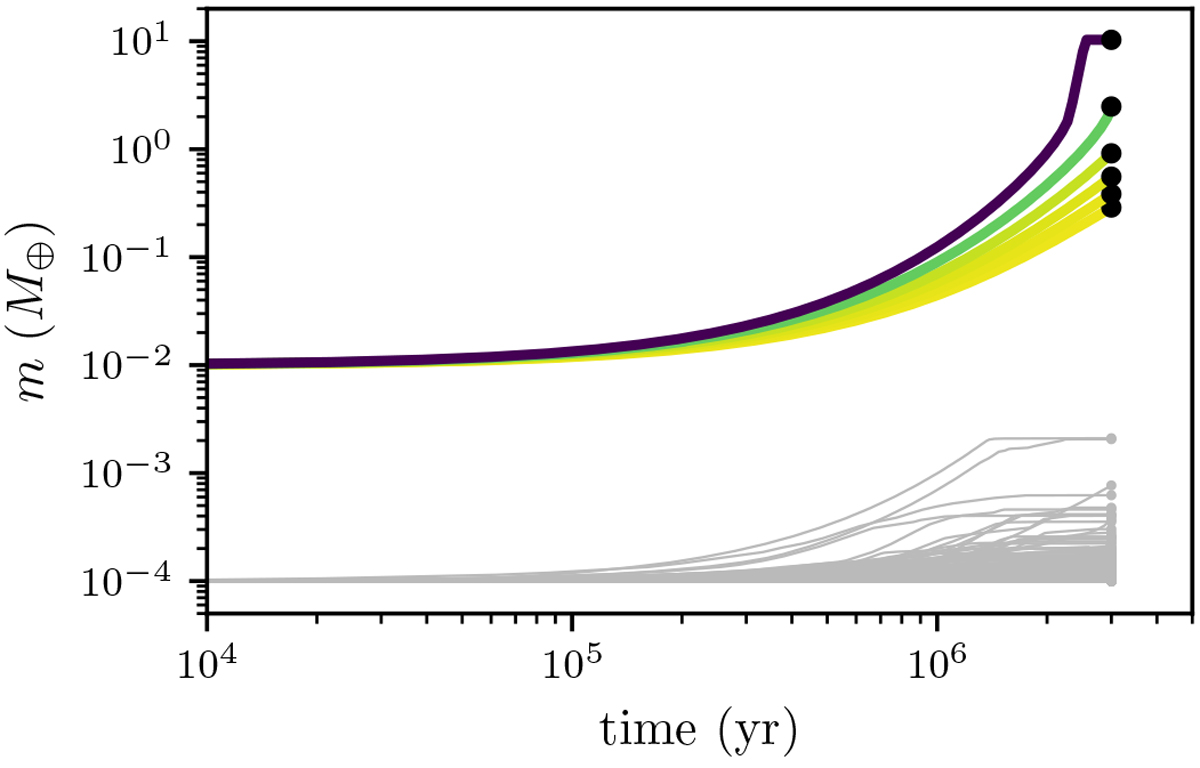
Mass evolution of planetesimals for collisions and pebble accretion in the giant planet region. Each line shows the growth history of a planetesimal or embryo. Bodies that grow more massive than 10−2 M⊕ are shown as coloured lines. The colour scales with mass and is the same as in Fig. 10. The grey lines show all other bodies. The endpoint of the simulation for each body is indicated with a circle. Because the bodies do not grow significantly before 104 yr, only the later times are shown.
Current usage metrics show cumulative count of Article Views (full-text article views including HTML views, PDF and ePub downloads, according to the available data) and Abstracts Views on Vision4Press platform.
Data correspond to usage on the plateform after 2015. The current usage metrics is available 48-96 hours after online publication and is updated daily on week days.
Initial download of the metrics may take a while.