Fig. 10
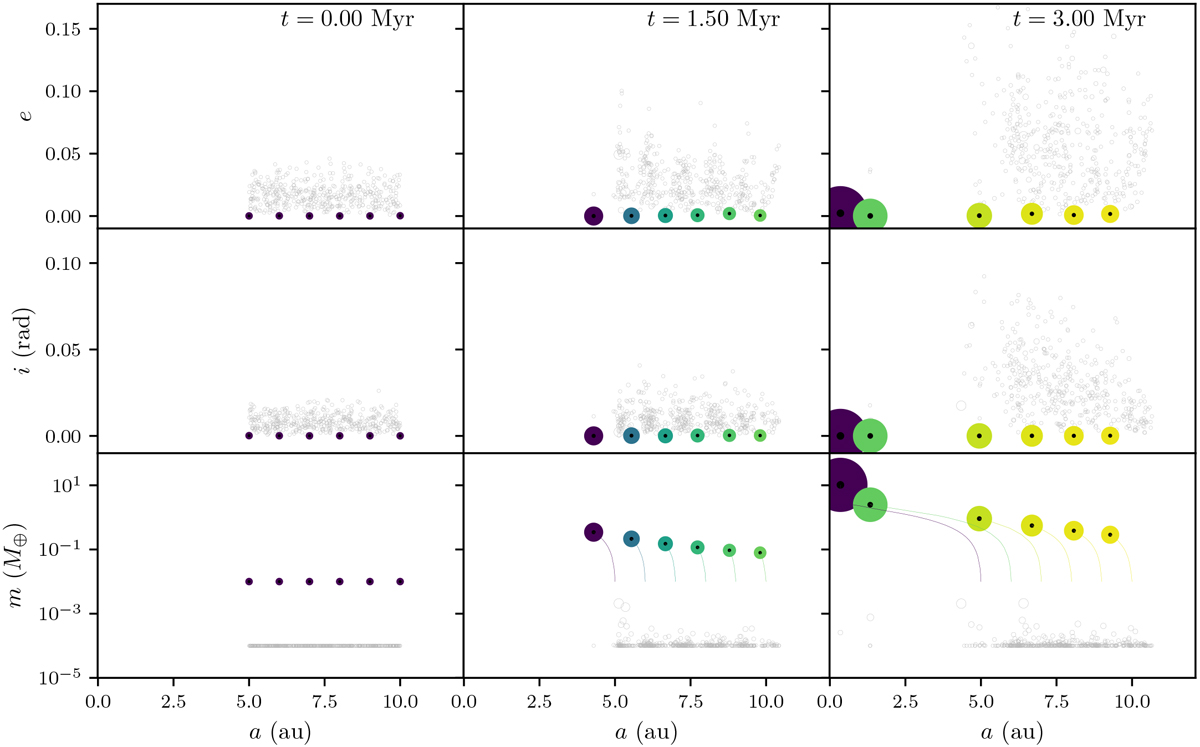
Pebble accretion and collisions in the giant planet region. Shown are the scatter plots for eccentricity (first row), inclination (second row), and mass (third row). A total mass of 0.1 M⊕ is distributed amongst 450 planetesimals between 5 au and 10 au. The three columns show snapshots at 0 Myr, 1.5 Myr, and at the final time of 3 Myr. Bodies that are more massive than 10−2 M⊕ are shown as coloured filled circles, their growth tracks are shown by the coloured lines, and the centre of the circle is indicated by a black dot. All other bodies are grey open circles. The colour and size of the symbols scale with the instantaneous mass.
Current usage metrics show cumulative count of Article Views (full-text article views including HTML views, PDF and ePub downloads, according to the available data) and Abstracts Views on Vision4Press platform.
Data correspond to usage on the plateform after 2015. The current usage metrics is available 48-96 hours after online publication and is updated daily on week days.
Initial download of the metrics may take a while.