Fig. 6.
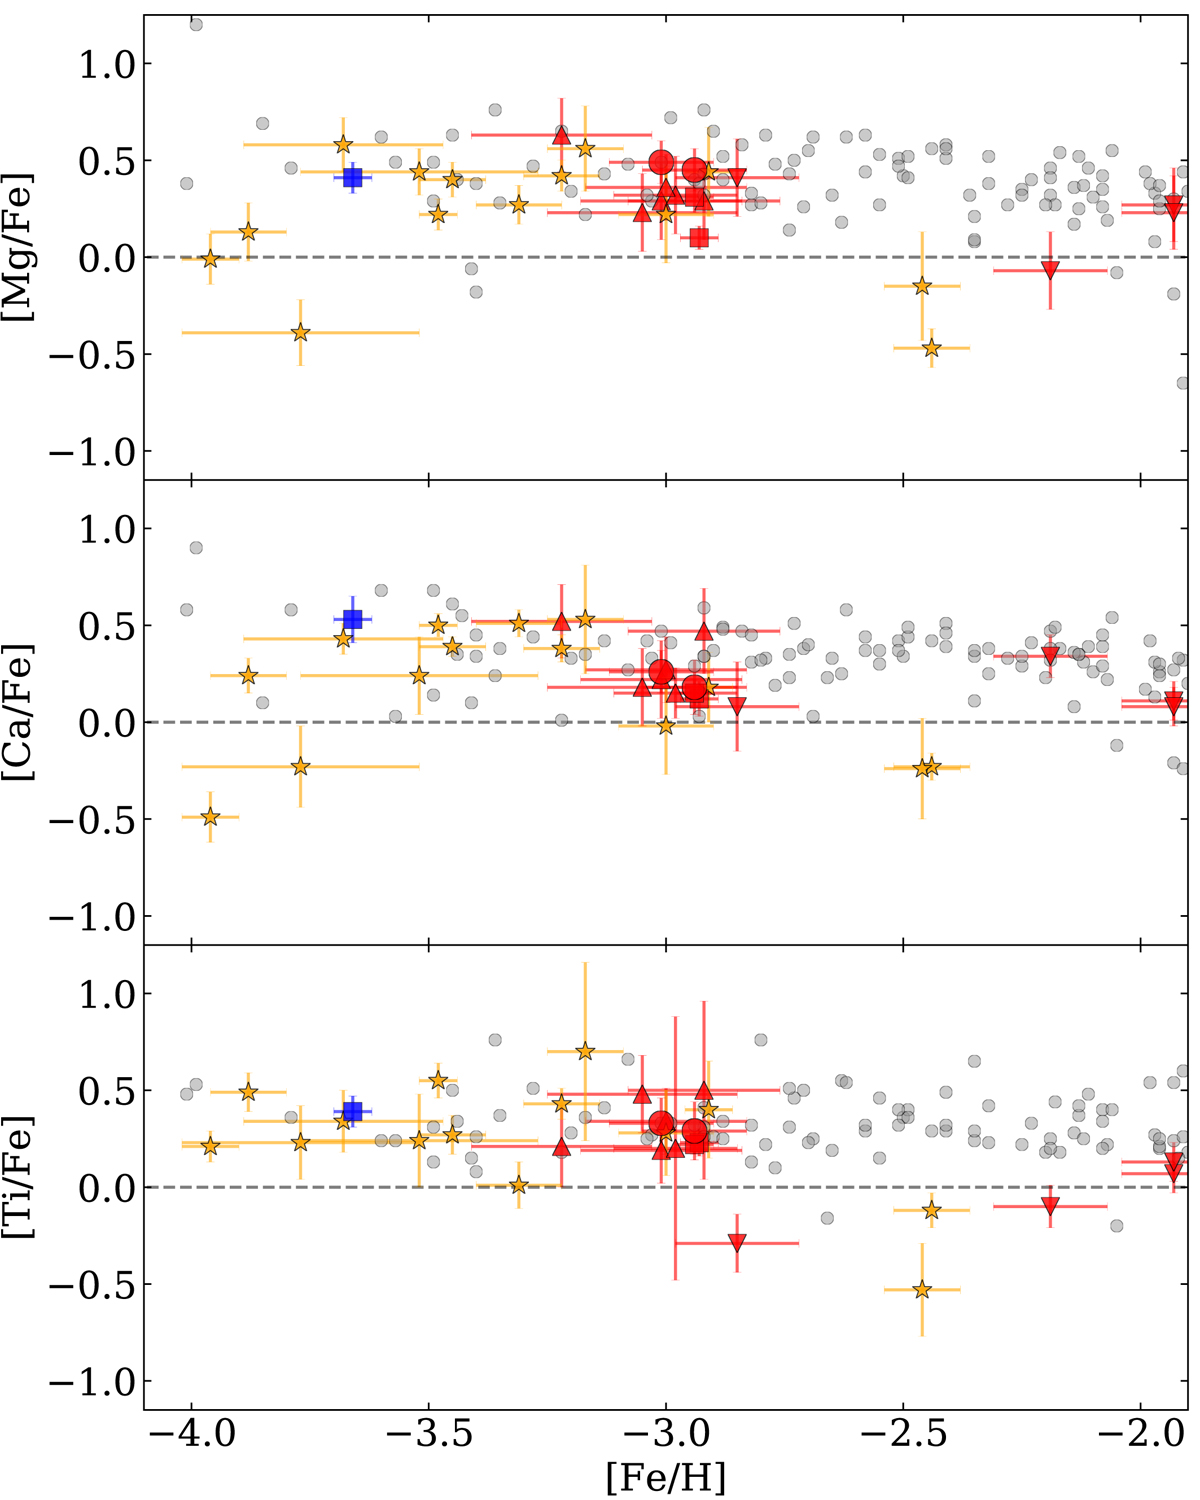
Abundance ratios for the α elements Mg, Ca, and Ti (from top to bottom) as a function of [Fe/H]. Sextans stars are large red symbols. The new EMP stars studied in this paper are the red circles. The sample of Aoki et al. (2009) that we reanalyzed is shown as red triangles. Data from Shetrone et al. (2001b) are upside-down triangles. Gray dots are literature data for MW halo stars (Venn et al. 2004; Cohen et al. 2013; Yong et al. 2013; Ishigaki et al. 2013). Orange and blue symbols refer to RGB stars observed in Sculptor (Jablonka et al. 2015; Tafelmeyer et al. 2010; Starkenburg et al. 2013; Simon et al. 2015) and Fornax (Tafelmeyer et al. 2010), respectively.
Current usage metrics show cumulative count of Article Views (full-text article views including HTML views, PDF and ePub downloads, according to the available data) and Abstracts Views on Vision4Press platform.
Data correspond to usage on the plateform after 2015. The current usage metrics is available 48-96 hours after online publication and is updated daily on week days.
Initial download of the metrics may take a while.