Fig. 8.
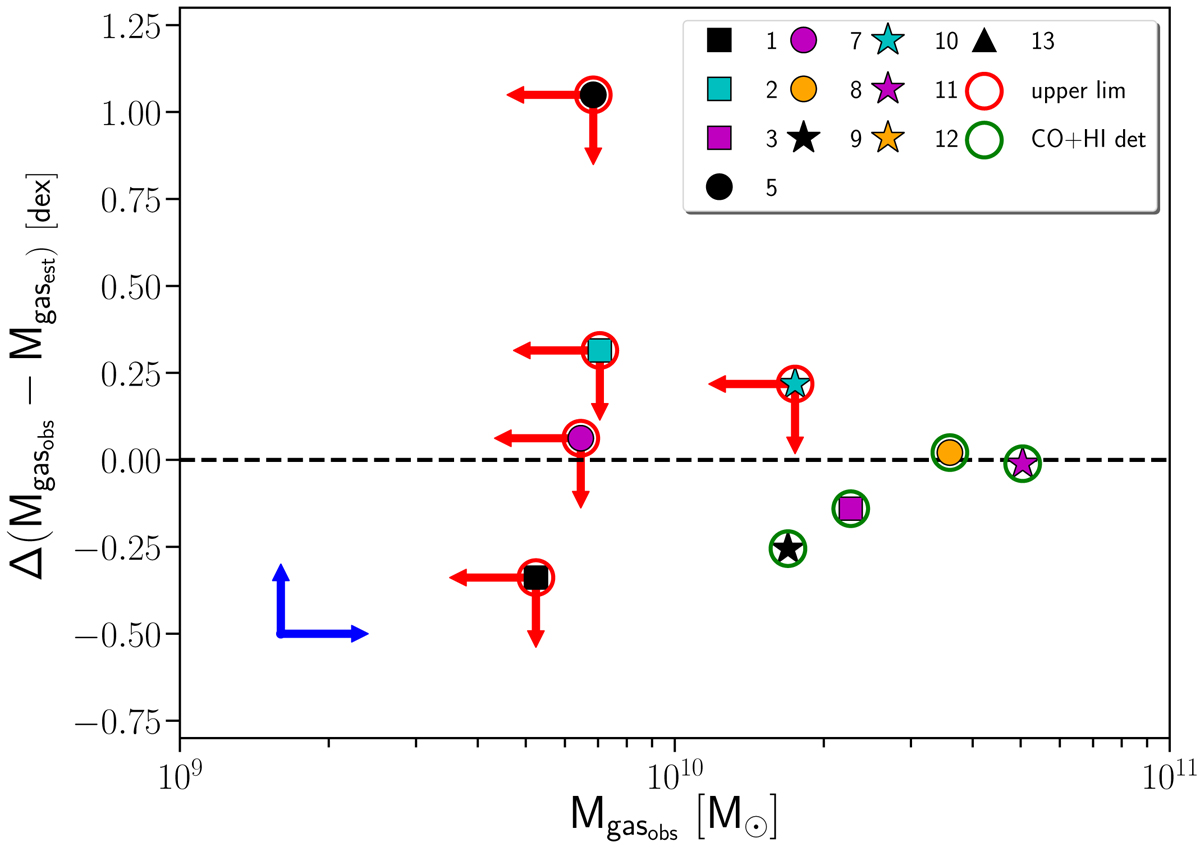
Total gas masses from combined CO(1–0) and H I observations vs. the difference between observed total gas mass (CO+HI) and the dust-based total gas mass. Galaxies with detection in CO+HI are circled in green, while measurements with CO and/or H I upper limits are shown in red. The CO upper limits may be affected by beam dilution that works in the direction of the blue arrows.
Current usage metrics show cumulative count of Article Views (full-text article views including HTML views, PDF and ePub downloads, according to the available data) and Abstracts Views on Vision4Press platform.
Data correspond to usage on the plateform after 2015. The current usage metrics is available 48-96 hours after online publication and is updated daily on week days.
Initial download of the metrics may take a while.