Fig. 6.
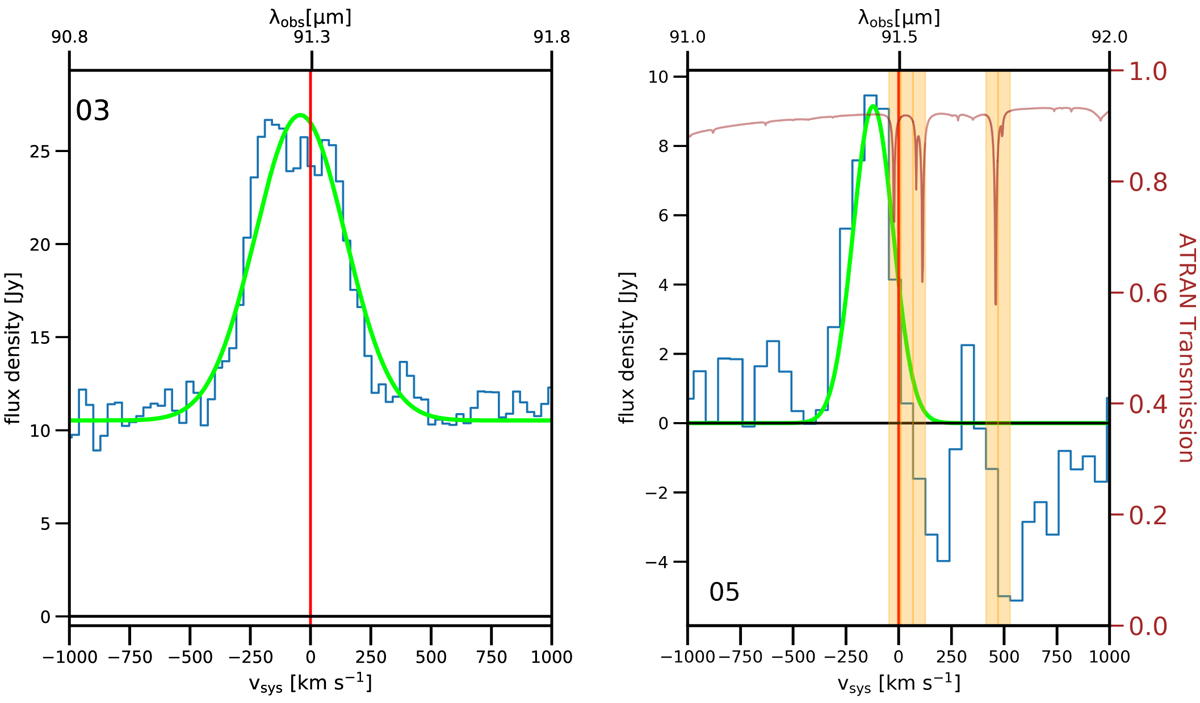
[O III]88 μm fine structure lines of LARS 3 (left) and 5 (right), obtained with Herschel/PACS and SOFIA/FIFI-LS respectively. Total fluxes were derived using Gaussian fits (see Table 6). For FIFI-LS data, the atmospheric absorption, calculated using ATRAN (Lord 1992), is shown as a red curve. Spectral ranges with strong atmospheric absorption (see orange range) were masked out for the fitting process. The zero-velocity (red vertical line) is related to the H I systemic velocity from Pardy et al. (2014).
Current usage metrics show cumulative count of Article Views (full-text article views including HTML views, PDF and ePub downloads, according to the available data) and Abstracts Views on Vision4Press platform.
Data correspond to usage on the plateform after 2015. The current usage metrics is available 48-96 hours after online publication and is updated daily on week days.
Initial download of the metrics may take a while.