Fig. 3.
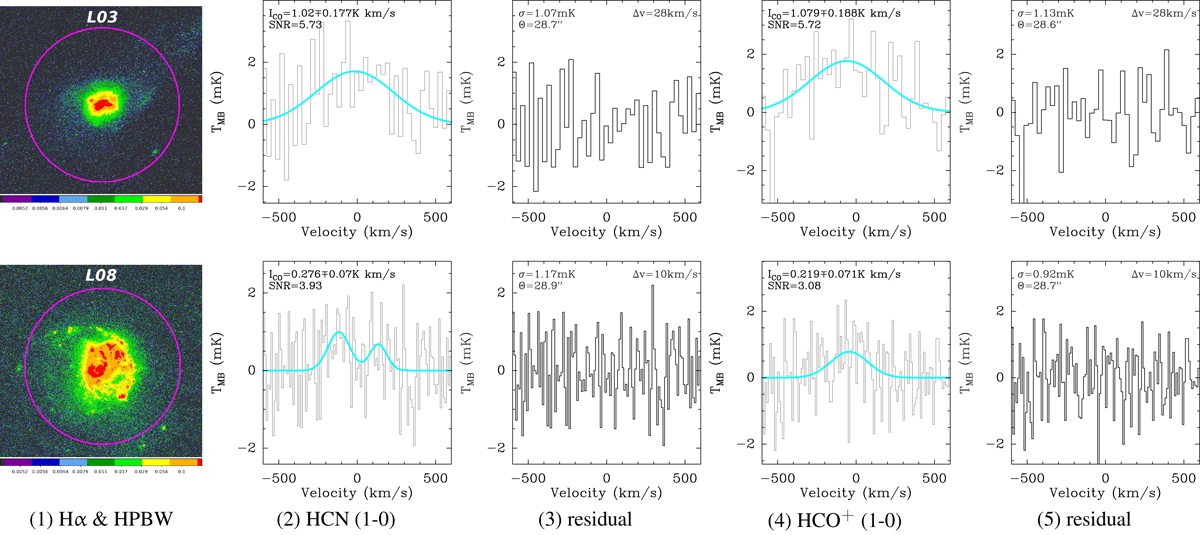
Detections of dense gas tracers in LARS 3 (top row) and 8 (bottom row). The beam sizes for the transitions are shown in Col. (1) on top of our HST Hα narrow band images. HCN and HCO+(1–0) spectra are shown in Cols. (2) and (4). Spectra are given on the TMB scale in milli Kelvin. Single or double Gaussian fits were performed to calculate the line flux. They are shown as cyan solid lines. The residuals after subtraction of the fits from the data are shown in Cols. (3) and (5).
Current usage metrics show cumulative count of Article Views (full-text article views including HTML views, PDF and ePub downloads, according to the available data) and Abstracts Views on Vision4Press platform.
Data correspond to usage on the plateform after 2015. The current usage metrics is available 48-96 hours after online publication and is updated daily on week days.
Initial download of the metrics may take a while.