Free Access
Fig. 2.
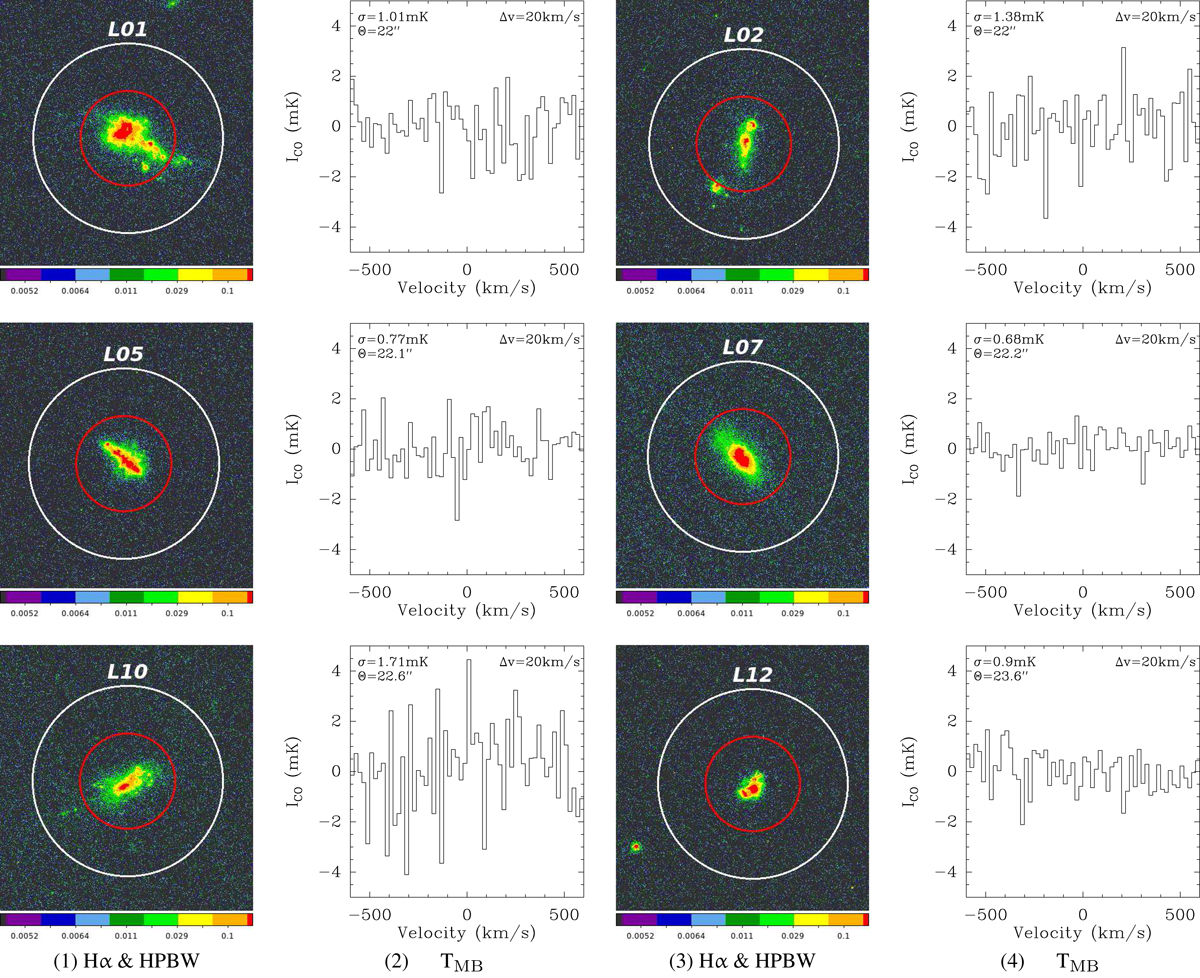
CO(1–0) non-detections of LARS galaxies. The beam size for the CO(1–0) transition is shown in Cols. (1) and (3) as white circle on top of our HST Hα narrow band images. The measured signals on the main beam brightness temperature scales are shown in Cols. (2) and (4).
Current usage metrics show cumulative count of Article Views (full-text article views including HTML views, PDF and ePub downloads, according to the available data) and Abstracts Views on Vision4Press platform.
Data correspond to usage on the plateform after 2015. The current usage metrics is available 48-96 hours after online publication and is updated daily on week days.
Initial download of the metrics may take a while.