Fig. B.1.
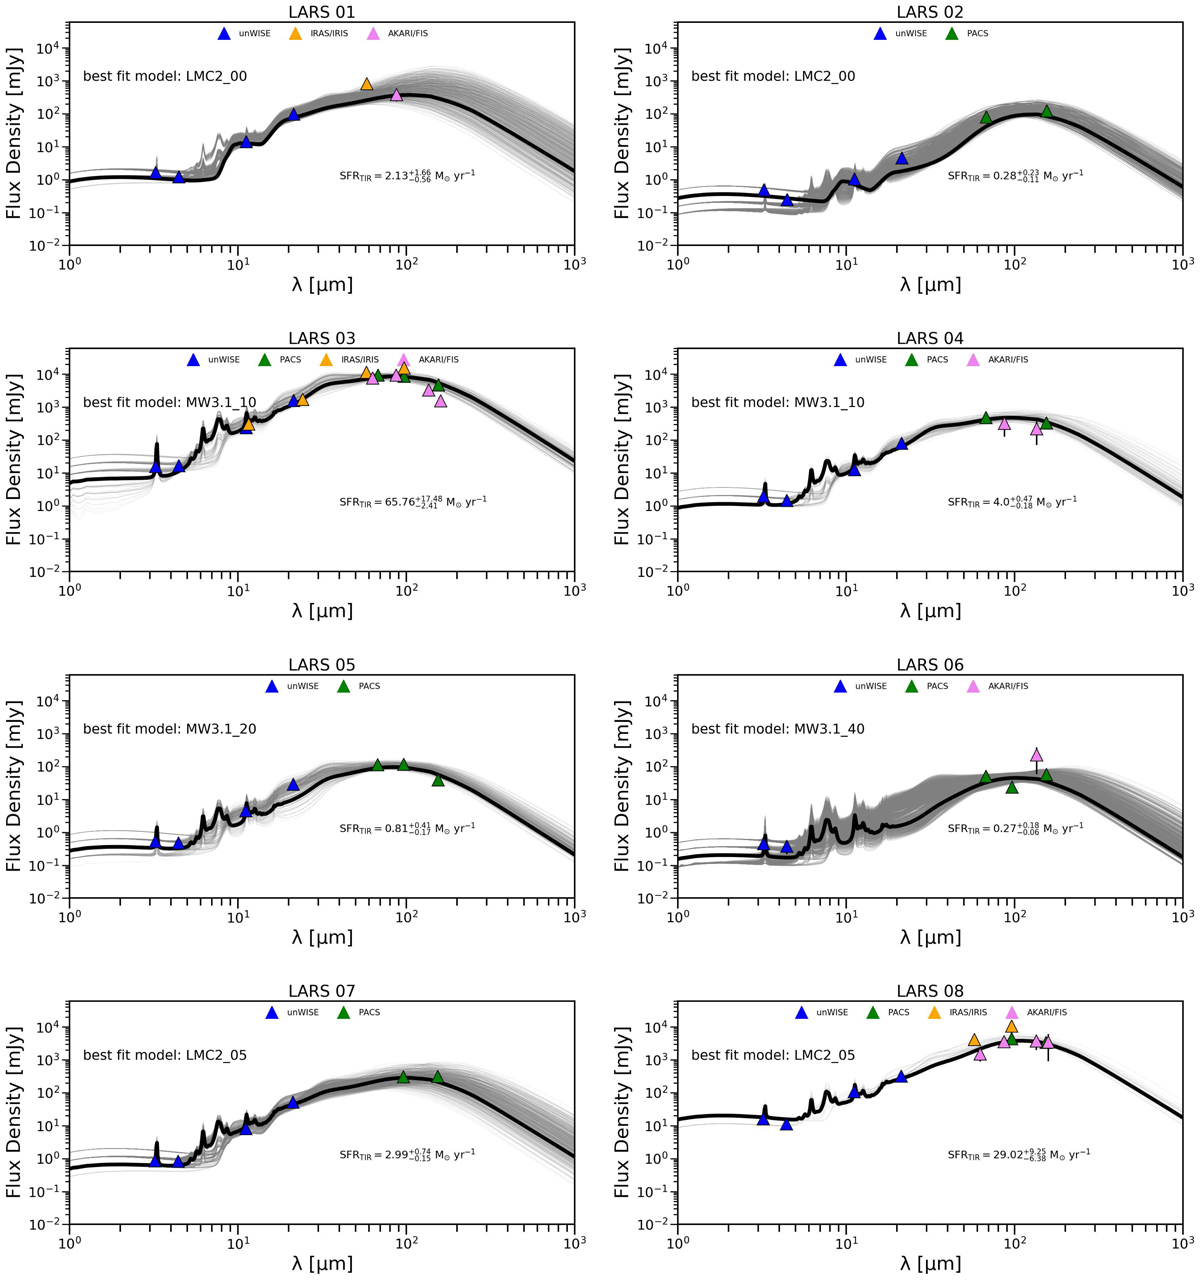
Infrared spectral energy distribution of LARS galaxies inferred from exploration of the parameter space using the Markov-chain Monte Carlo method. The best-fit SED is indicated by a thick black curve and was found from the 50% quantile of the logarithmic posterior distribution. The other fits that are shown (thin grey lines) are those lying within the quantile-based credible interval corresponding to 16% and 84%. They thus represent our uncertainties.
Current usage metrics show cumulative count of Article Views (full-text article views including HTML views, PDF and ePub downloads, according to the available data) and Abstracts Views on Vision4Press platform.
Data correspond to usage on the plateform after 2015. The current usage metrics is available 48-96 hours after online publication and is updated daily on week days.
Initial download of the metrics may take a while.