Fig. 12.
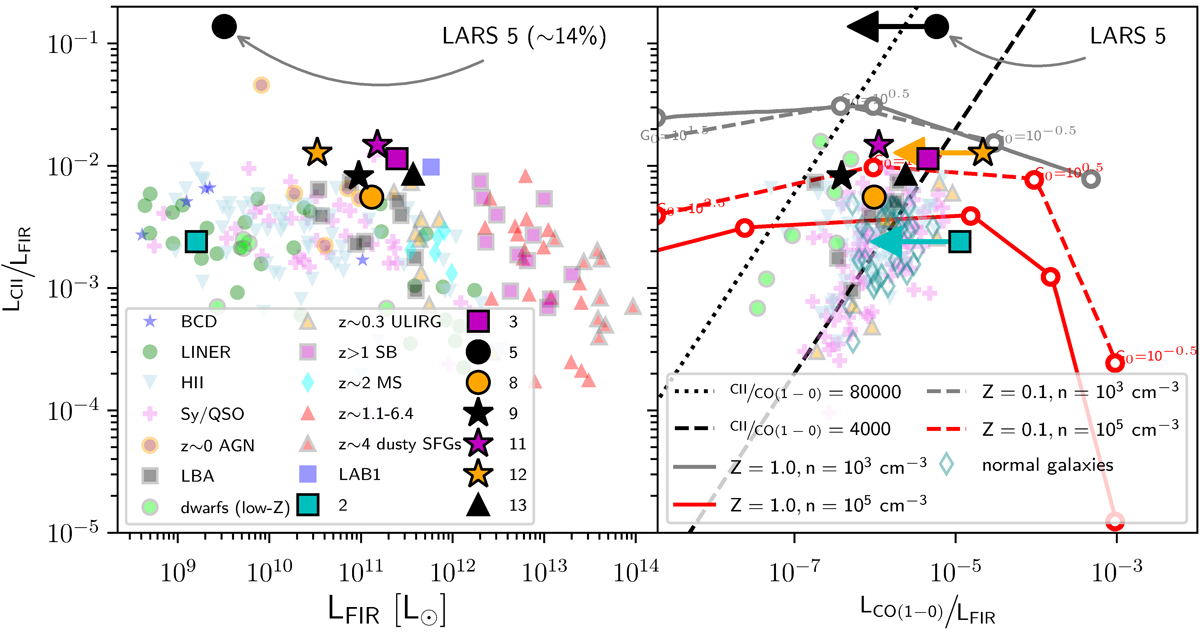
LCII 158 μm line to LFIRn, H88 ratio for LARS galaxies as a function of LFIRw (left panel) and as a function of the LCO10 line to LFIRn, H88 ratio (right panel), together with reference data. For the left plot, we updated the compilation in Graciá-Carpio et al. (2011, Fig. 1), and added samples of Lyman break analogues (LBA) from Contursi et al. (2017), local low-metallicity dwarfs from Cormier et al. (2014), Cormier et al. (2015), z ∼ 0 active galactic nuclei from the CARS survey (Smirnova-Pinchukova et al. 2019), z ∼ 0.3 ULIRGs from Magdis et al. (2014), z > 1 starbursts (SB > 1) taken from Carilli & Walter (2013), z ∼ 2 main-sequence galaxies (Zanella et al. 2018), the Lyman alpha Blob 1 (LAB1) at z ∼ 3.1 from Umehata et al. (2017), and z > 4 dusty star-forming galaxies (Bothwell et al. 2017). The right hand plot is based on Contursi et al. (2017, Fig. 9), which we updated by adding normal galaxies from De Breuck et al. (2011) (originally drawn from Stacey et al. 2010), as well as local low-metallicity dwarfs from Cormier et al. (2010, 2014, 2015) and Madden & Cormier (2018). Black dotted and dashed lines in the right panel indicate constant [C II]-to-CO(1–0) ratios of 80 000 and 4000 respectively. Red and grey solid curves show PDR models from Kaufman et al. (1999) for densities of n = 105 and n = 103 cm−3 at solar metallicity (Z = 1.0), while dashed curves indicate low metallicity (Z = 0.1). For the low-metallicity cases, the changing FUV radiation field along the curves is given in steps of 1 dex in G0 from right to left.
Current usage metrics show cumulative count of Article Views (full-text article views including HTML views, PDF and ePub downloads, according to the available data) and Abstracts Views on Vision4Press platform.
Data correspond to usage on the plateform after 2015. The current usage metrics is available 48-96 hours after online publication and is updated daily on week days.
Initial download of the metrics may take a while.