Fig. 7.
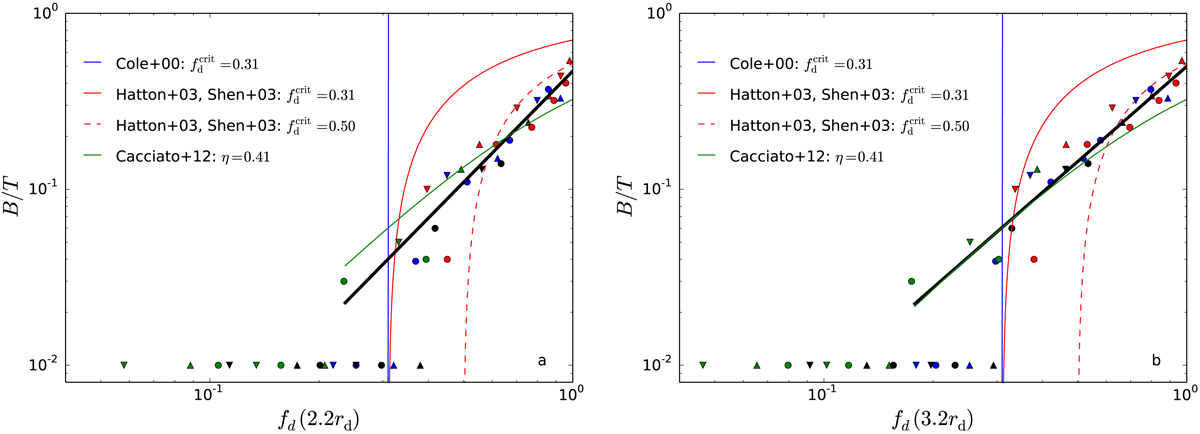
Relation between bulge-to-total mass ratio B/T and initial disc fraction fd(r) for r = 2.2rd (left) and r = 3.2rd (right). Triangles pointing up, circles, and triangles pointing down correspond to simulations with c = 5, c = 10, and c = 15, respectively. The colours correspond to different disc-to-virial mass ratios: md = 0.005 (green), md = 0.01 (black), md = 0.02 (blue), and md = 0.04 (red). Symbols with B/T = 0.01 correspond to bulgeless galaxies. They have been assigned B/T = 0.01 merely to be able to show them on a logarithmic diagram. The thick solid black lines are log-log linear least-squares fits to the symbols with B/T > 0.01. They correspond to Eqs. (18) and (19). The vertical blue lines show the critical fd that corresponds to the α = 0.28 (equivalent to assuming ϵ = 1.1 in Eq. (1)) The coloured curves compare our results to previous models (Cole et al. 2000; Hatton et al. 2003; Shen et al. 2003; Cacciato et al. 2012).
Current usage metrics show cumulative count of Article Views (full-text article views including HTML views, PDF and ePub downloads, according to the available data) and Abstracts Views on Vision4Press platform.
Data correspond to usage on the plateform after 2015. The current usage metrics is available 48-96 hours after online publication and is updated daily on week days.
Initial download of the metrics may take a while.