Fig. 6.
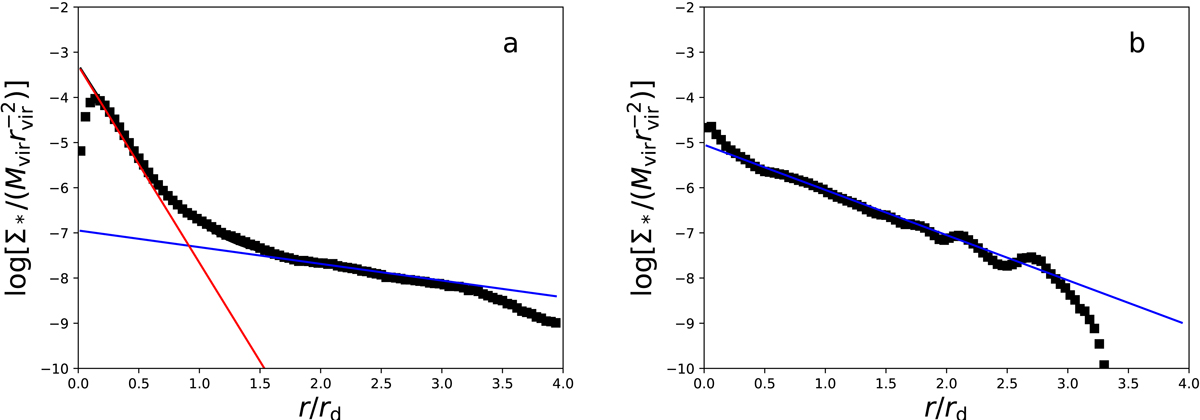
Stellar surface-density for two of our simulated galaxies (black symbols). Galaxy a has been fitted with the sum of an exponential profile (blue line) and a Sérsic profile, with n = 1 in this particular case (red line). Its bulge-to-total mass ratio is B/T = 0.22. The black curve shows the sum of the two components. Galaxy b is consistent with a single exponential profile (blue line).
Current usage metrics show cumulative count of Article Views (full-text article views including HTML views, PDF and ePub downloads, according to the available data) and Abstracts Views on Vision4Press platform.
Data correspond to usage on the plateform after 2015. The current usage metrics is available 48-96 hours after online publication and is updated daily on week days.
Initial download of the metrics may take a while.