Fig. 10.
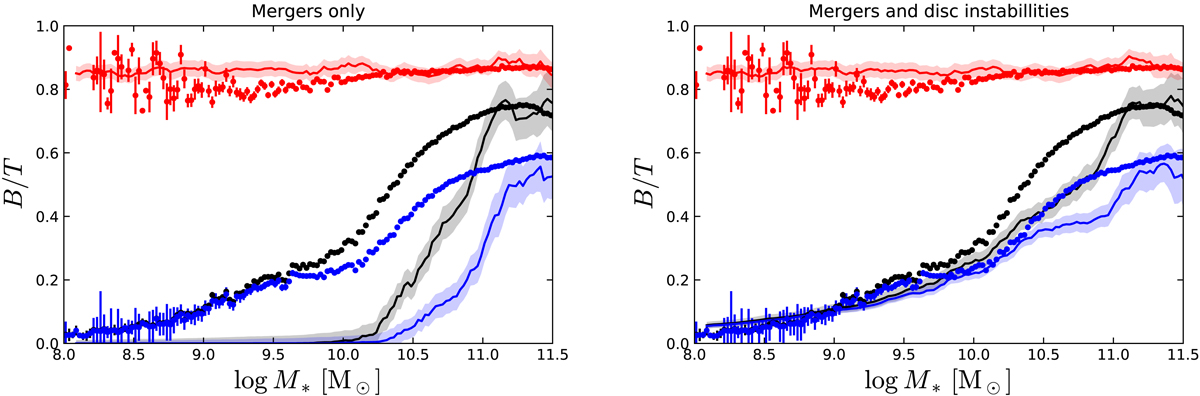
B/T versus M* for all galaxies (black), spiral galaxies (B/T < 0.7, blue), and elliptical galaxies (B/T > 0.7, red). The curves are medians in bins of stellar mass. They refer to GalICS 2.0 without (left) and with (right) disc instabilities. The data points are the observations by Mendel et al. (2014). The width of the shaded areas around the curves shows the standard error on the median.
Current usage metrics show cumulative count of Article Views (full-text article views including HTML views, PDF and ePub downloads, according to the available data) and Abstracts Views on Vision4Press platform.
Data correspond to usage on the plateform after 2015. The current usage metrics is available 48-96 hours after online publication and is updated daily on week days.
Initial download of the metrics may take a while.