Fig. 1.
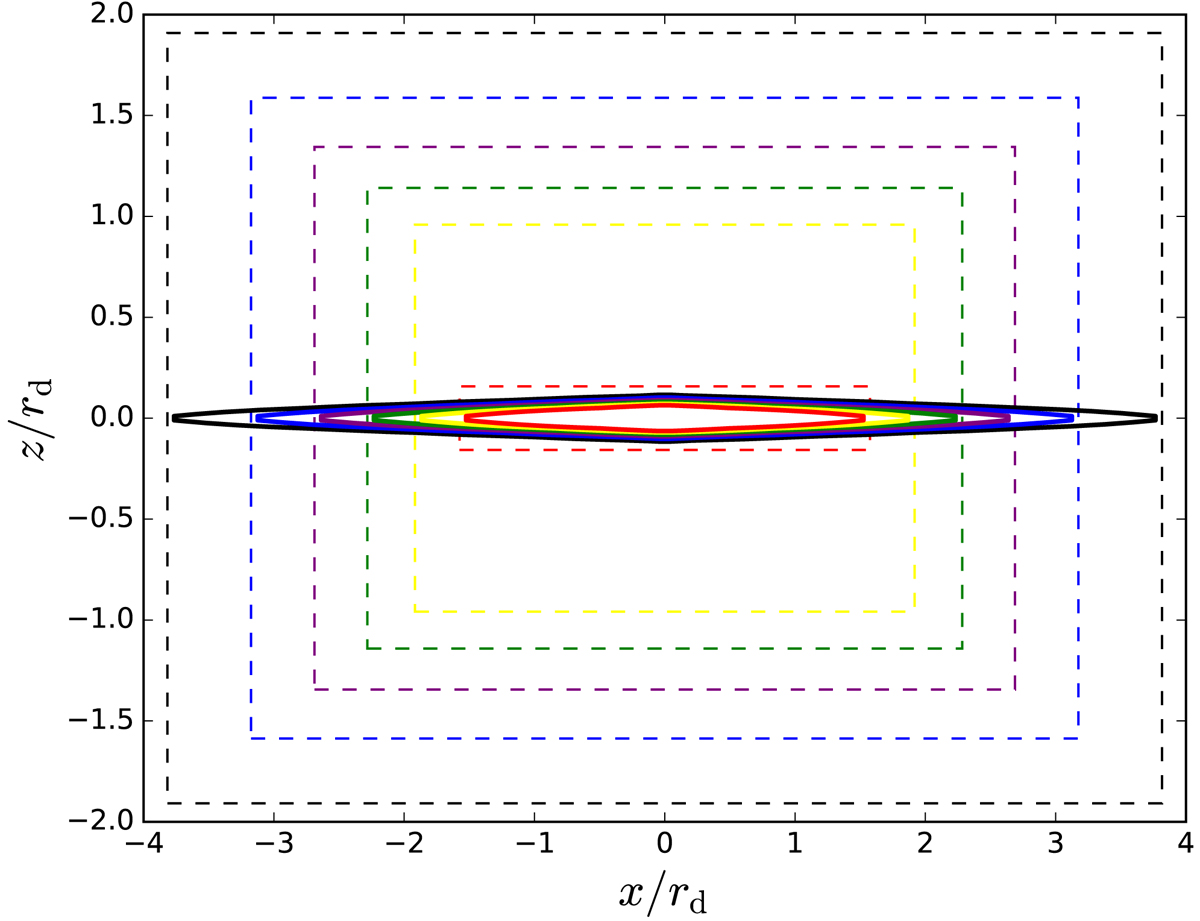
Initial conditions and refinement regions. The black, blue, violet, green, yellow, and red curves show the isodensity contours that contain 90%, 80%, 70%, 60%, 50%, and 40% of the disc mass at t = 0, respectively. The black, blue, violet, green, yellow, and red dashed lines show the cylinders within which the cell size equals 1/8, 1/16, 1/32, 1/64, 1/128, and 1/256 of the disc exponential scale length, respectively.
Current usage metrics show cumulative count of Article Views (full-text article views including HTML views, PDF and ePub downloads, according to the available data) and Abstracts Views on Vision4Press platform.
Data correspond to usage on the plateform after 2015. The current usage metrics is available 48-96 hours after online publication and is updated daily on week days.
Initial download of the metrics may take a while.