Fig. 8.
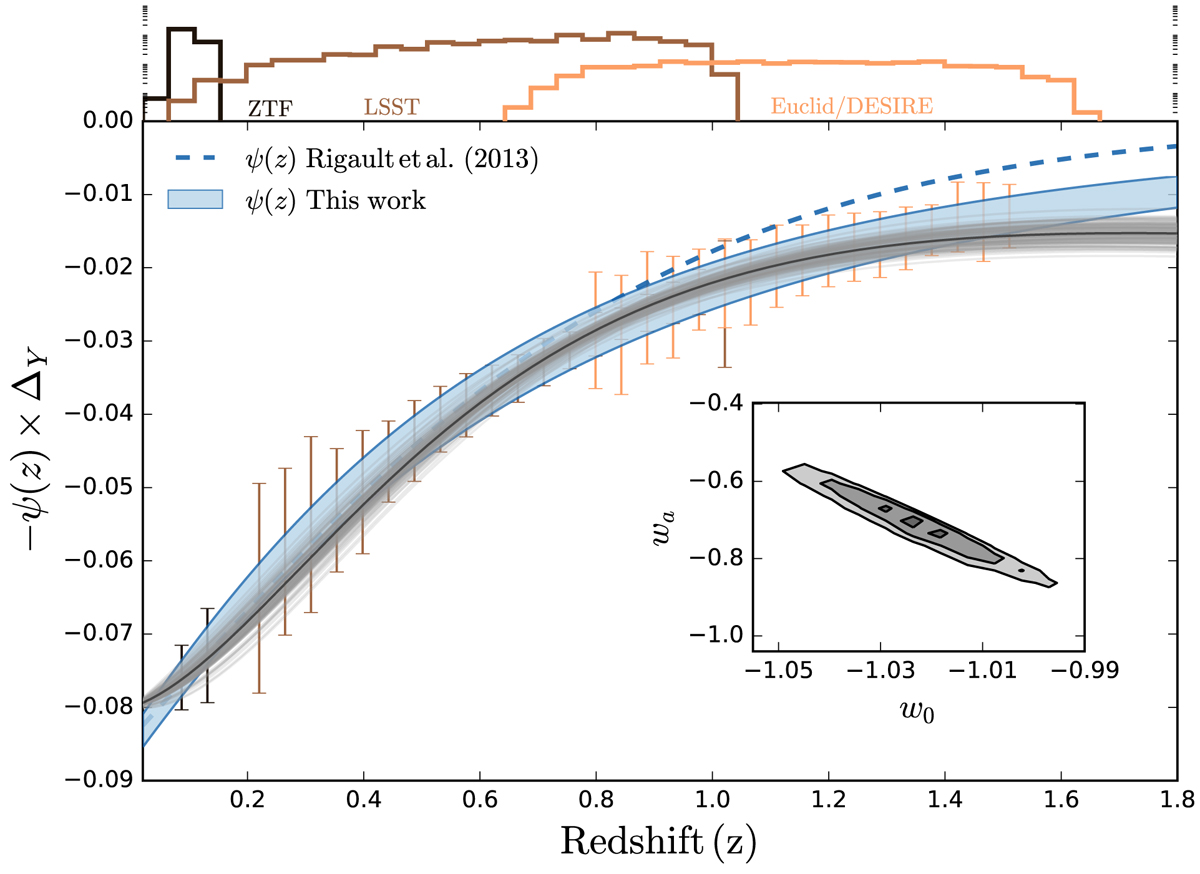
Evolution of the LsSFR bias, −ψ(z) × ΔY, with redshift, as predicted by Eq (7). The blue band shows the expected redshift evolution of −ψ(z) × ΔY when accounting for uncertainties on ϕ. The result of using the ψ(z) parametrization in Rigault et al. (2013) is shown as a blue dash line for comparison (see also Childress et al. 2014). To quantify the impact of the LsSFR bias, we simulate data following the expected SN rate and data quality of ZTF, LSST and EUCLID/DESIRE (see text). The expected numbers of SNe Ia are shown above the main plot on a logarithmic scale, color coded by sample. The expected binned uncertainties on the measurements of −ψ(z) × ΔY are shown in the main plot, following the same color code. Randomly drawn MCMC realizations of the fitted magnitude difference between a flat w0 waCMD and a flat ΛCDM are shown as a grey band. The black line is the best fit value. The extracted w0, wa posterior distribution is displayed in the inset plot. This figure illustrates that the LsSFR bias would be mistakenly attributed to the key properties of dark energy that future surveys hope to measure.
Current usage metrics show cumulative count of Article Views (full-text article views including HTML views, PDF and ePub downloads, according to the available data) and Abstracts Views on Vision4Press platform.
Data correspond to usage on the plateform after 2015. The current usage metrics is available 48-96 hours after online publication and is updated daily on week days.
Initial download of the metrics may take a while.