Fig. 6.
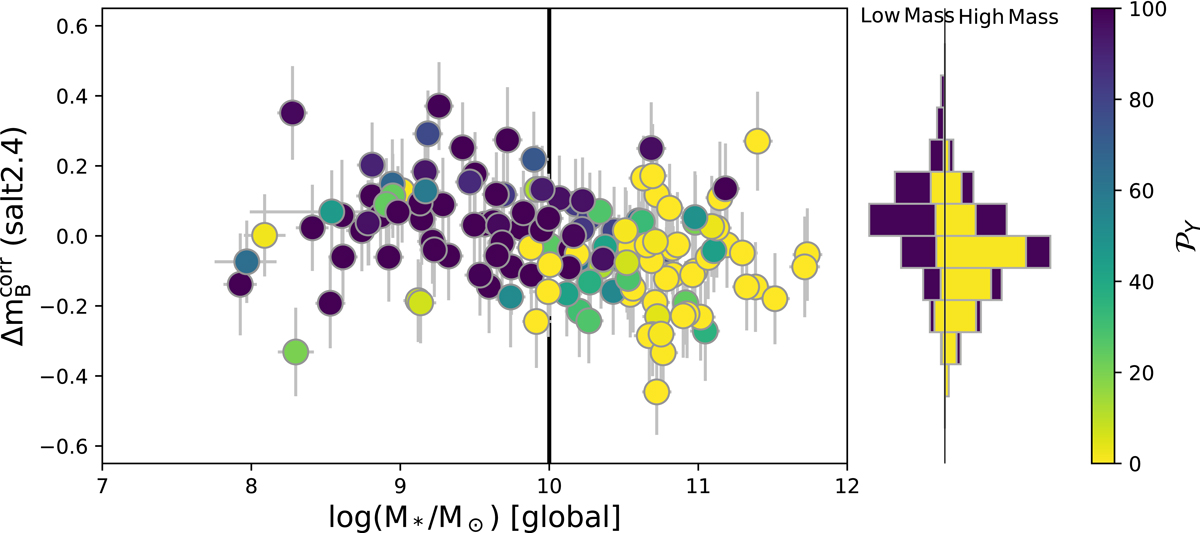
SN Ia Hubble residuals, ![]() , calculated from a conventional linear standardization using SALT2.4 lightcurve parameters, as a function of the host-galaxy global stellar mass, log(M*/M⊙). The color code follows that of Fig. 4. The histograms on the right are 𝒫HM-weighted marginalizations of
, calculated from a conventional linear standardization using SALT2.4 lightcurve parameters, as a function of the host-galaxy global stellar mass, log(M*/M⊙). The color code follows that of Fig. 4. The histograms on the right are 𝒫HM-weighted marginalizations of ![]() , and thus show the contribution of the low and high global stellar mass subsamples.
, and thus show the contribution of the low and high global stellar mass subsamples.
Current usage metrics show cumulative count of Article Views (full-text article views including HTML views, PDF and ePub downloads, according to the available data) and Abstracts Views on Vision4Press platform.
Data correspond to usage on the plateform after 2015. The current usage metrics is available 48-96 hours after online publication and is updated daily on week days.
Initial download of the metrics may take a while.