Fig. 5.
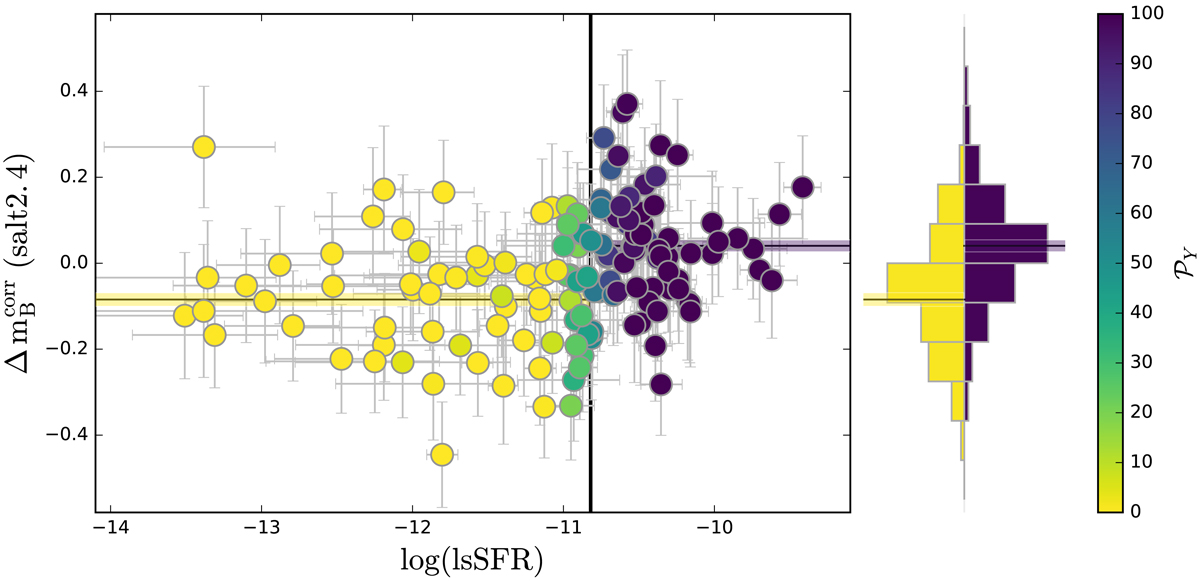
SN Ia Hubble residuals, ![]() , as a function of log(LsSFR), calculated from a conventional linear standardization using SALT2.4 lightcurve parameters. The plot symbols and histograms follow the rules of Fig. 4. In the main panel and in the histogram-panel, the two horizontal bands show the weighted average of
, as a function of log(LsSFR), calculated from a conventional linear standardization using SALT2.4 lightcurve parameters. The plot symbols and histograms follow the rules of Fig. 4. In the main panel and in the histogram-panel, the two horizontal bands show the weighted average of ![]() per progenitor age group. The width of each band represents the corresponding error on the mean, and their offset illustrates the Hubble residual offset between the two age groups. The error bars on
per progenitor age group. The width of each band represents the corresponding error on the mean, and their offset illustrates the Hubble residual offset between the two age groups. The error bars on ![]() include the measurement, SALT2.4 systematic, and residual dispersions from the maximum-likelihood fit to each population.
include the measurement, SALT2.4 systematic, and residual dispersions from the maximum-likelihood fit to each population.
Current usage metrics show cumulative count of Article Views (full-text article views including HTML views, PDF and ePub downloads, according to the available data) and Abstracts Views on Vision4Press platform.
Data correspond to usage on the plateform after 2015. The current usage metrics is available 48-96 hours after online publication and is updated daily on week days.
Initial download of the metrics may take a while.