Fig. 3.
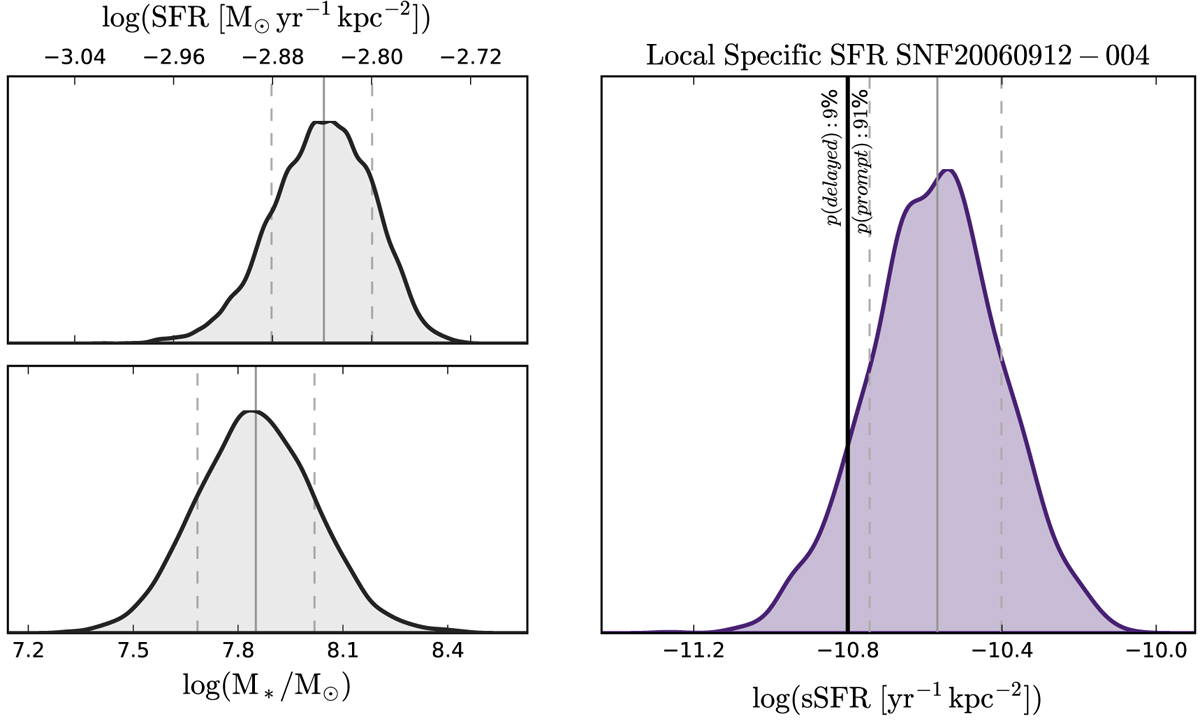
Illustration of how measurement uncertainties taken from posterior distributions for local SFR and local stellar mass are used to construct the posterior distribution for LsSFR. Top left: the local log(SFR); lower left: the local log(M*/M⊙) (see also Fig. 2); right: the resulting local log(sSFR). The vertical grey solid lines indicate the median of each distribution, and the two dashed lines delimit the 16th to 84th percentile range. On the LsSFR plot, the thick vertical black line shows log(LsSFRcut) = − 10.8. This figure again exemplifies a moderate signal to noise ratio case using the host galaxy for SNF20060912-004.
Current usage metrics show cumulative count of Article Views (full-text article views including HTML views, PDF and ePub downloads, according to the available data) and Abstracts Views on Vision4Press platform.
Data correspond to usage on the plateform after 2015. The current usage metrics is available 48-96 hours after online publication and is updated daily on week days.
Initial download of the metrics may take a while.