Fig. 2.
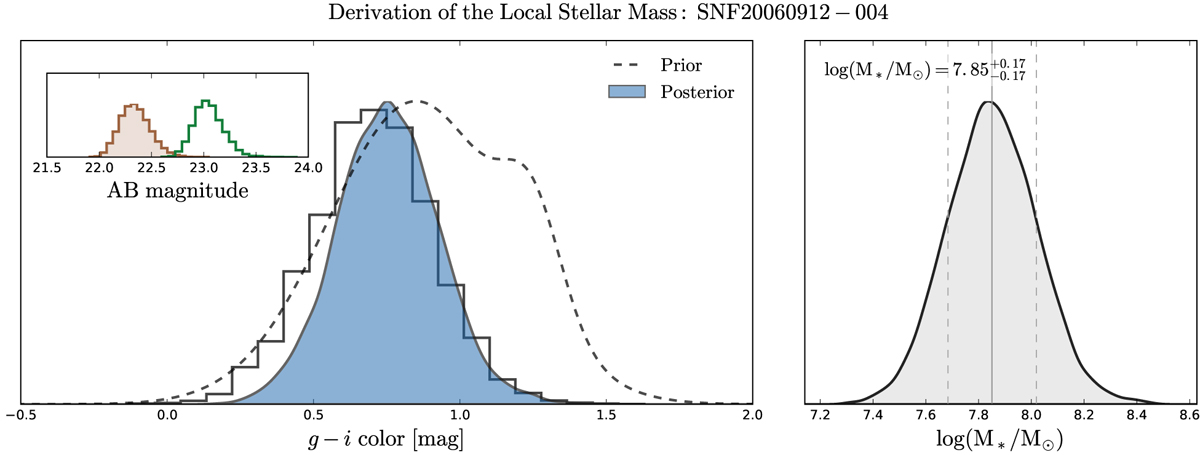
Illustration of how local stellar mass is derived, for the case of a typical moderate signal-to-noise case – the host of SNF20060912-004. Left: (g − i) color distributions: the histogram shows the likelihood distribution measured from the individual g and i magnitude distributions shown in the inset plot (where the open green histogram represents g and the filled brown histogram represents i). The dashed line shows the prior distribution and the filled blue envelope shows the reconstruction of the (g − i) posterior distribution. Right: the posterior distribution of the local stellar mass; the vertical grey solid line indicates the median of the distribution and the two dashed lines show the 16th and 84th percentile values.
Current usage metrics show cumulative count of Article Views (full-text article views including HTML views, PDF and ePub downloads, according to the available data) and Abstracts Views on Vision4Press platform.
Data correspond to usage on the plateform after 2015. The current usage metrics is available 48-96 hours after online publication and is updated daily on week days.
Initial download of the metrics may take a while.