Fig. 1.
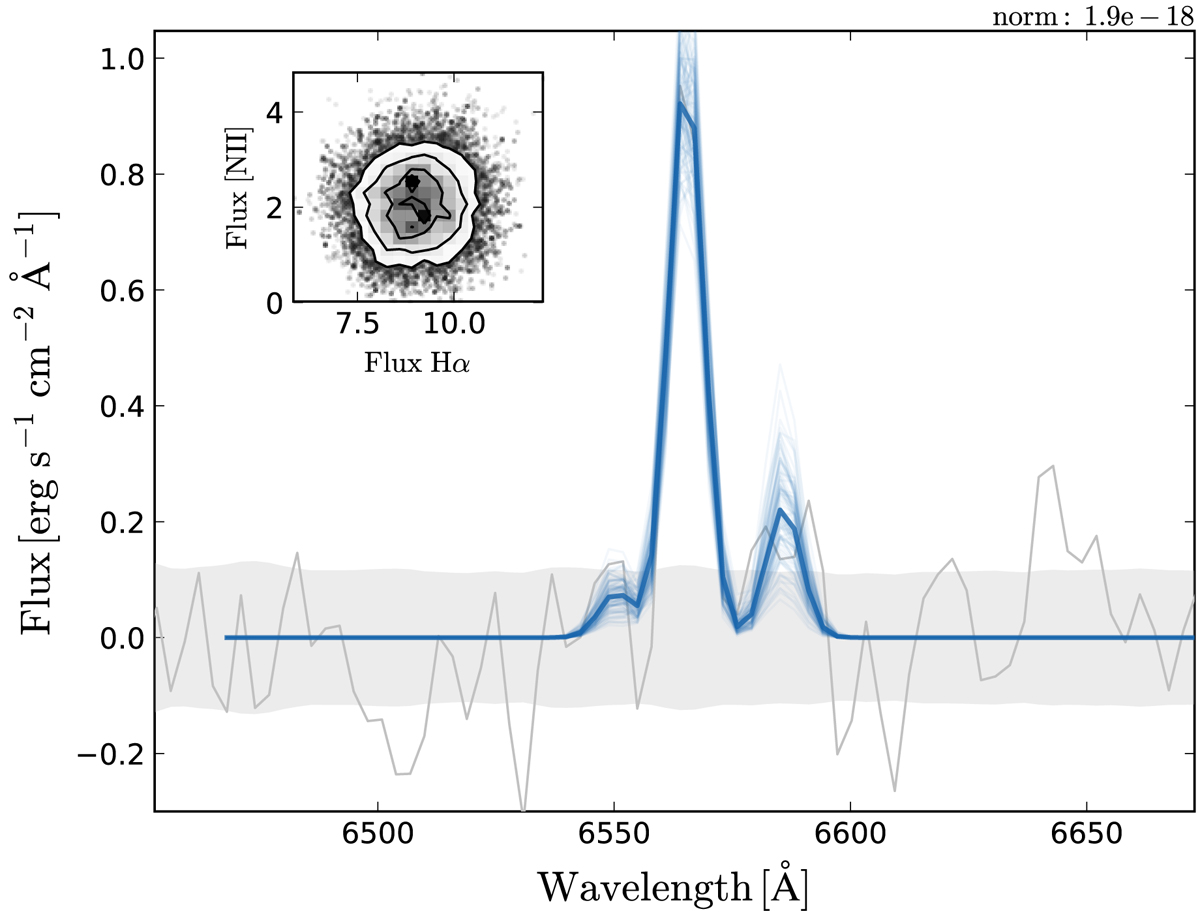
Illustration of a fit to the Hα + [N II] λλ6548,6584 emission line complex for the host of SNF20060912-004, a typical moderate signal-to-noise case. The gray line shows the emission line spectrum of the local host. The grey band represents its uncertainty, centered around zero. The thick blue line shows the best posterior estimation. The thin blue lines represent 100 realizations from the posterior distribution, illustrating the fit uncertainties. A posterior density sampling in the Hα versus [N II] flux plane is displayed as an inset.
Current usage metrics show cumulative count of Article Views (full-text article views including HTML views, PDF and ePub downloads, according to the available data) and Abstracts Views on Vision4Press platform.
Data correspond to usage on the plateform after 2015. The current usage metrics is available 48-96 hours after online publication and is updated daily on week days.
Initial download of the metrics may take a while.