Fig. 4.
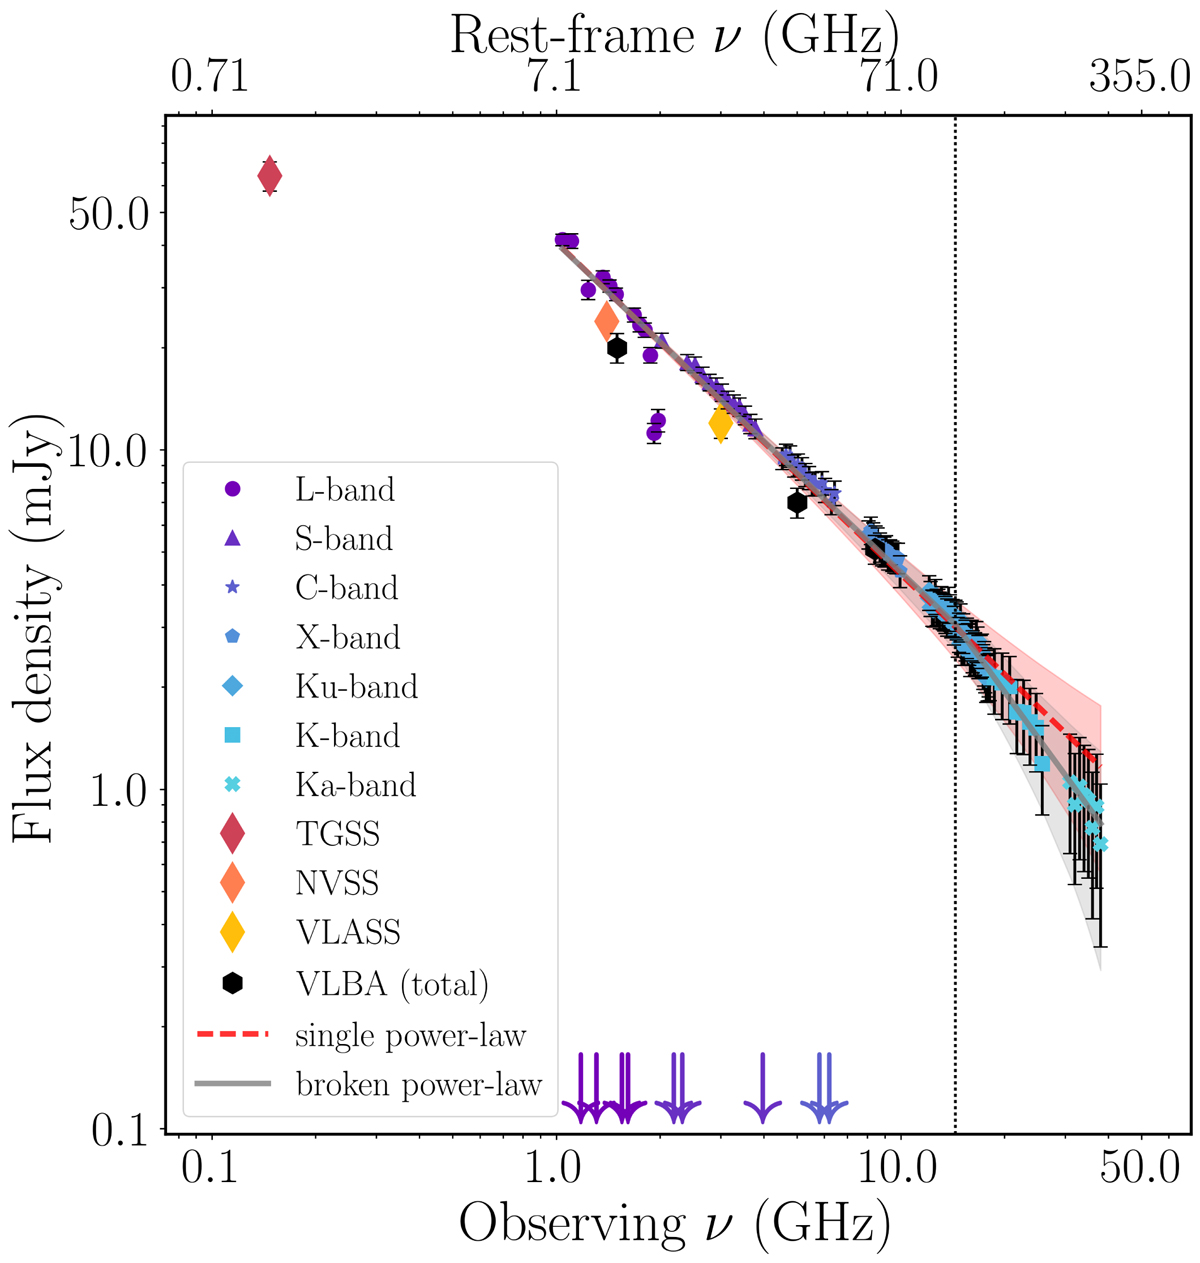
Radio spectrum of PSO J0309+27 from 0.147 up to 40 GHz. The VLA observations from 1.4 to 40 GHz are represented with different symbols for each band as indicated in the legend (bottom left corner). Archival TGSS, NVSS, and VLASS observations are indicated with diamonds, while the total flux density of the VLBA observations is reported as filled black hexagons. The arrows indicate flagged spws. The red (dashed) and grey (solid) lines stand for the single and broken power-law fits, respectively, where the shaded areas represent the uncertainties of the fits (same colour coding). The vertical dotted line indicates the frequency break of the broken power-law fit (14.5 GHz).
Current usage metrics show cumulative count of Article Views (full-text article views including HTML views, PDF and ePub downloads, according to the available data) and Abstracts Views on Vision4Press platform.
Data correspond to usage on the plateform after 2015. The current usage metrics is available 48-96 hours after online publication and is updated daily on week days.
Initial download of the metrics may take a while.