Fig. 3.
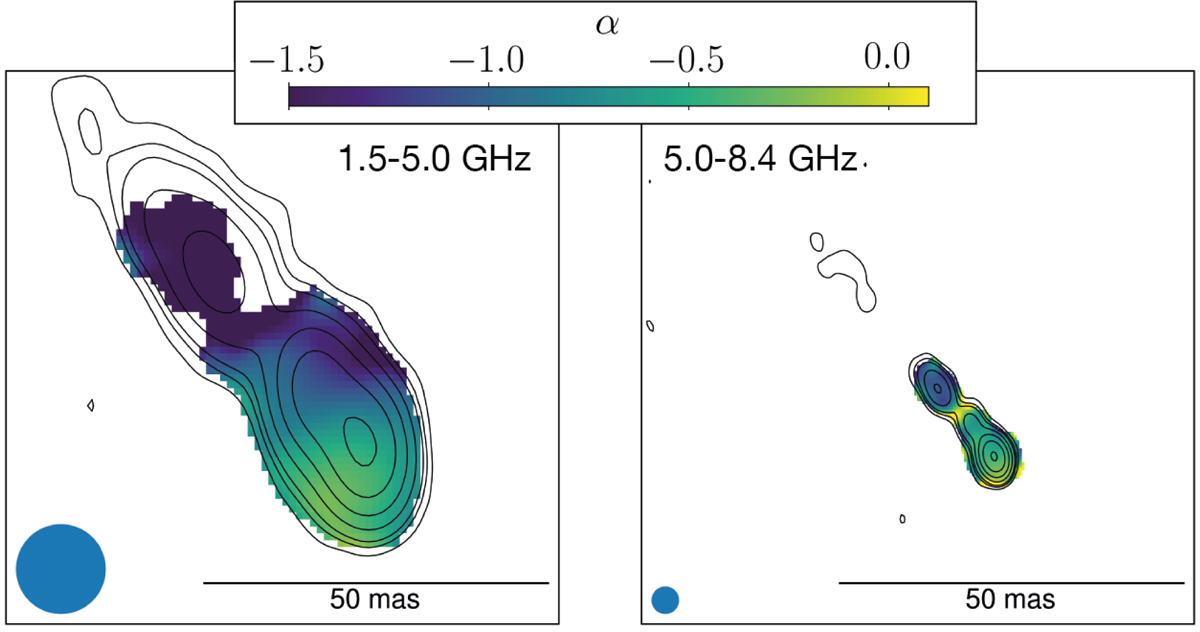
Spectral index maps of PSO J0309+27 (Sν ∝ να) for the frequency pairs 1.5−5.0 GHz (left) and 5.0−8.4 GHz (right). The black contours are the 1.5 GHz emission on the left, and the 5 GHz emission on the right, with the same increasing scheme as Fig. 1. The circular restoring beam is 13 mas FWHM (1.5−5.0 GHz image) and 4 mas FWHM (5.0−8.4 GHz image), and it is shown in the bottom left corner of each map.
Current usage metrics show cumulative count of Article Views (full-text article views including HTML views, PDF and ePub downloads, according to the available data) and Abstracts Views on Vision4Press platform.
Data correspond to usage on the plateform after 2015. The current usage metrics is available 48-96 hours after online publication and is updated daily on week days.
Initial download of the metrics may take a while.