Fig. 2.
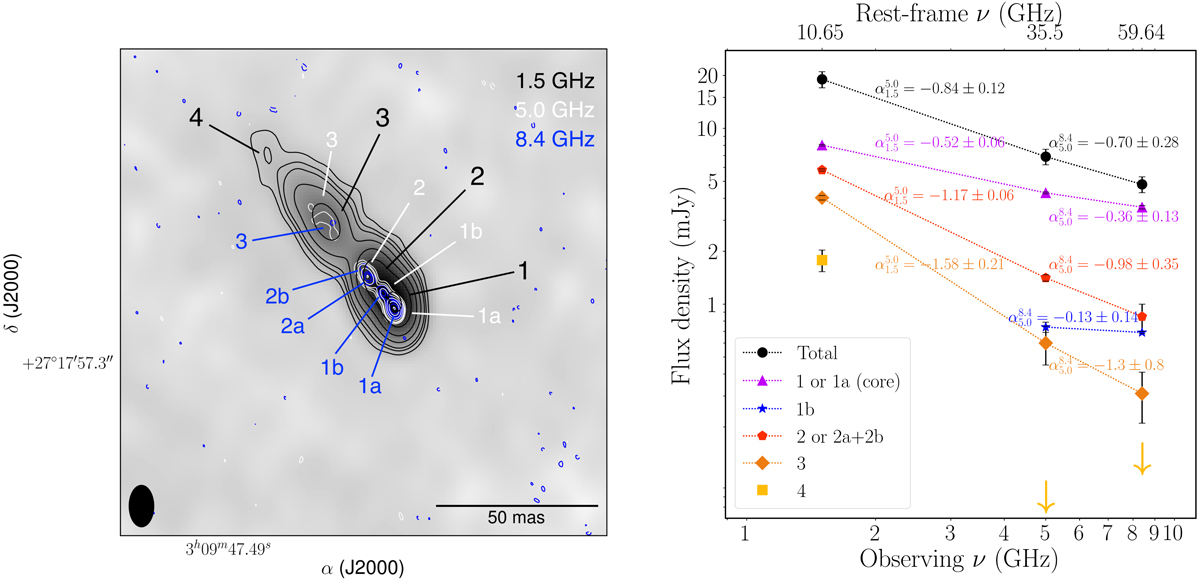
Left: overlay of the 1.5 (black contours), 5 (white contours), and 8.4 GHz (blue contours) emission of PSO J0309+27. The greyscale map is the 1.5 GHz self-calibrated image, and its restoring beam is shown in the bottom left corner; north is up, and east is left. The phased referenced absolute position of component 1a is 03h09m47.4862s, +27°17′57.3165″. Right: radio spectrum of all the sub-components of PSO J0309+27 spatially resolved by the multi-frequency VLBI observations presented here. We indicate the 3σ detection limit for sub-component 4 at 5 and 8.4 GHz with arrows, estimated as three times the flux density within the same area of the 1.5 GHz detection of that sub-component.
Current usage metrics show cumulative count of Article Views (full-text article views including HTML views, PDF and ePub downloads, according to the available data) and Abstracts Views on Vision4Press platform.
Data correspond to usage on the plateform after 2015. The current usage metrics is available 48-96 hours after online publication and is updated daily on week days.
Initial download of the metrics may take a while.