Fig. 1.
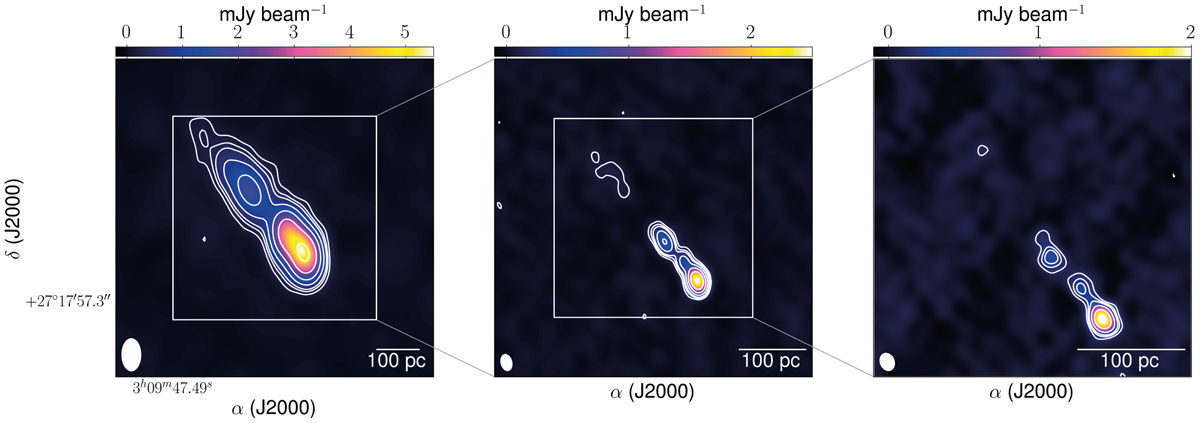
Self-calibrated images of PSO J0309+27 at 1.5 GHz (left), 5 GHz (centre), and 8.4 GHz (right). The contours are drawn at (−3, 3, 6, 9, 18, 36, 72, and 144) times the off-source noise of each map, which are given in Table B.1. The white colour bar indicates 100 pc in projection at z = 6.1. The restoring Gaussian beam is shown in white in the bottom left corner of each image; north is up, and east is left.
Current usage metrics show cumulative count of Article Views (full-text article views including HTML views, PDF and ePub downloads, according to the available data) and Abstracts Views on Vision4Press platform.
Data correspond to usage on the plateform after 2015. The current usage metrics is available 48-96 hours after online publication and is updated daily on week days.
Initial download of the metrics may take a while.