Fig. 3
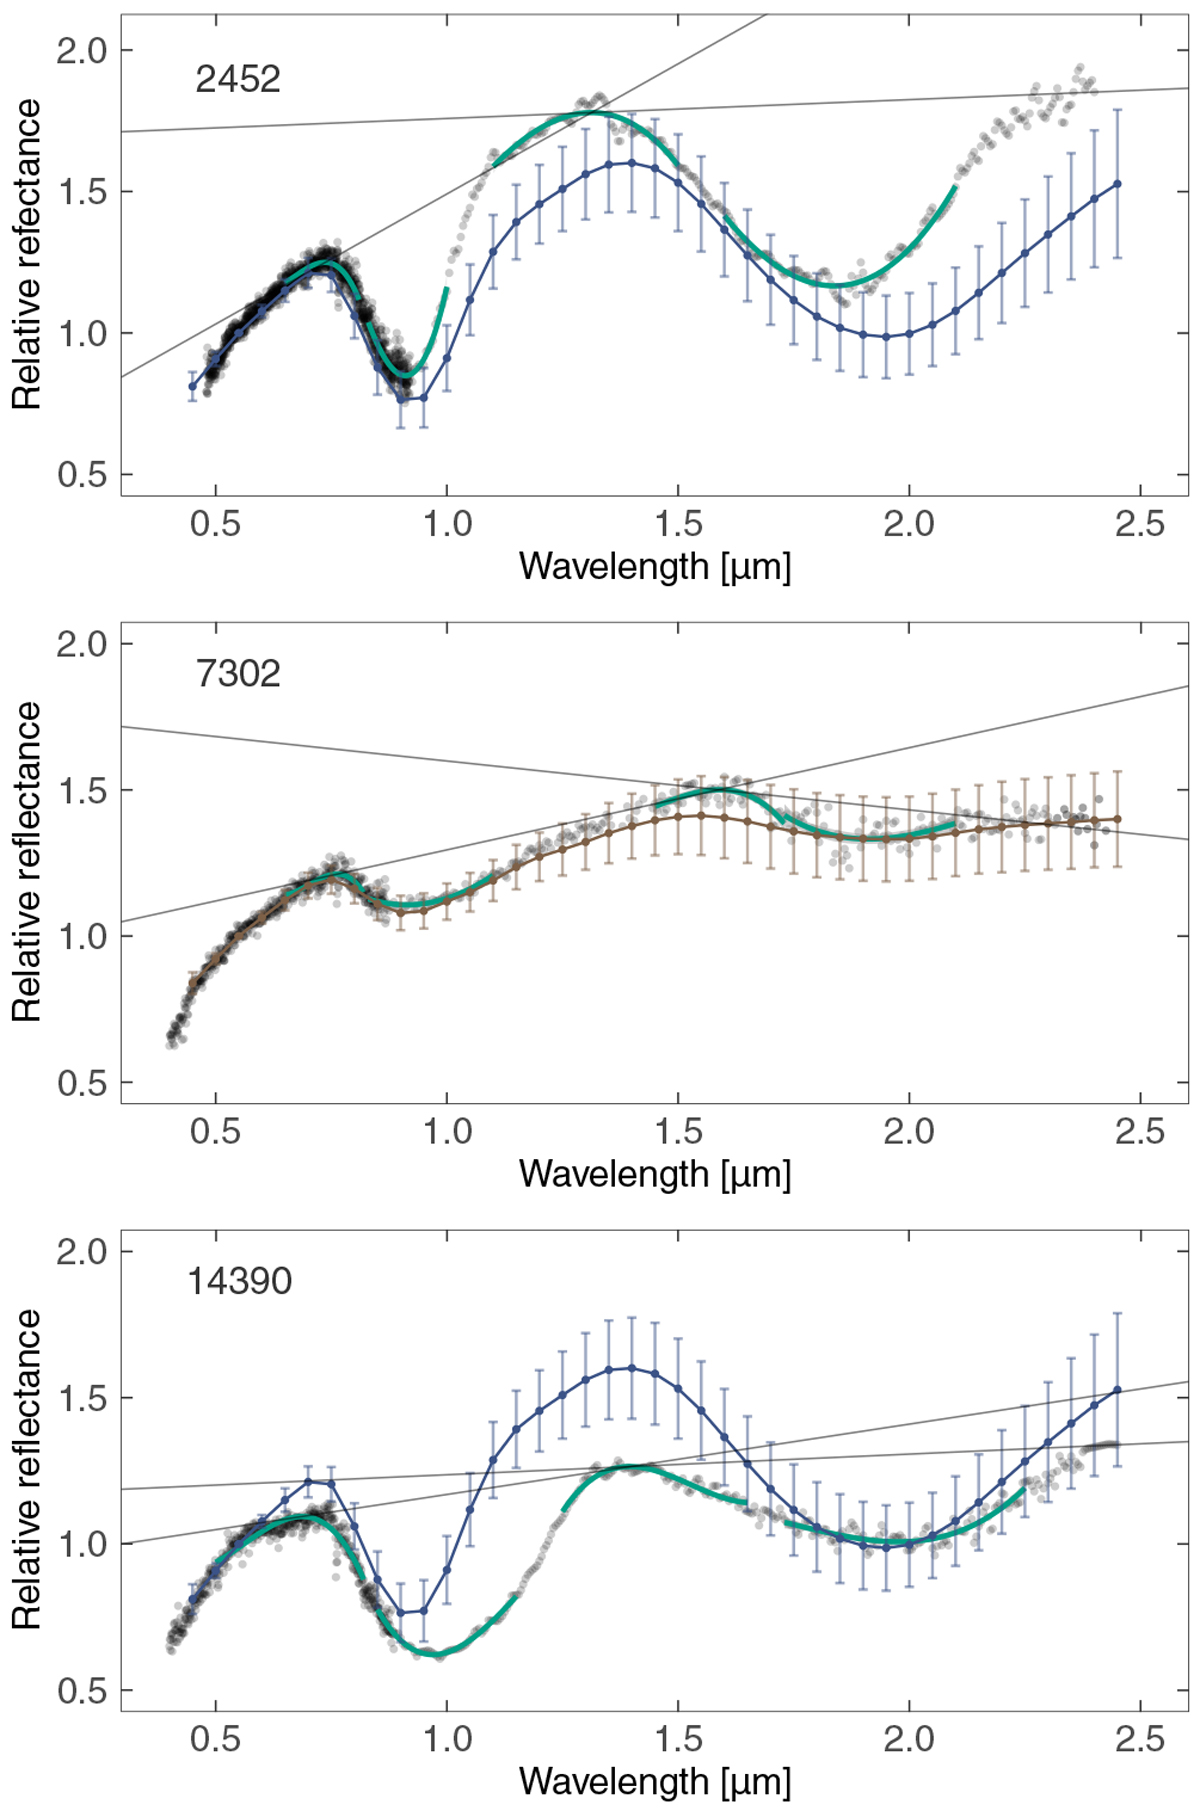
Visible and near-infrared spectra of the three middle and outer main belt asteroids (MOVs) studied in this work (grey points). The blue and brown curves represent average spectra corresponding to the V-type and S-type taxonomic classes, respectively, and their standard deviation as defined by DeMeo et al. (2009). The green curves are fourth-order polynomial fits to the maxima and the minima used to compute Slope I and II (straight black lines).
Current usage metrics show cumulative count of Article Views (full-text article views including HTML views, PDF and ePub downloads, according to the available data) and Abstracts Views on Vision4Press platform.
Data correspond to usage on the plateform after 2015. The current usage metrics is available 48-96 hours after online publication and is updated daily on week days.
Initial download of the metrics may take a while.